9
9peptides
spectra
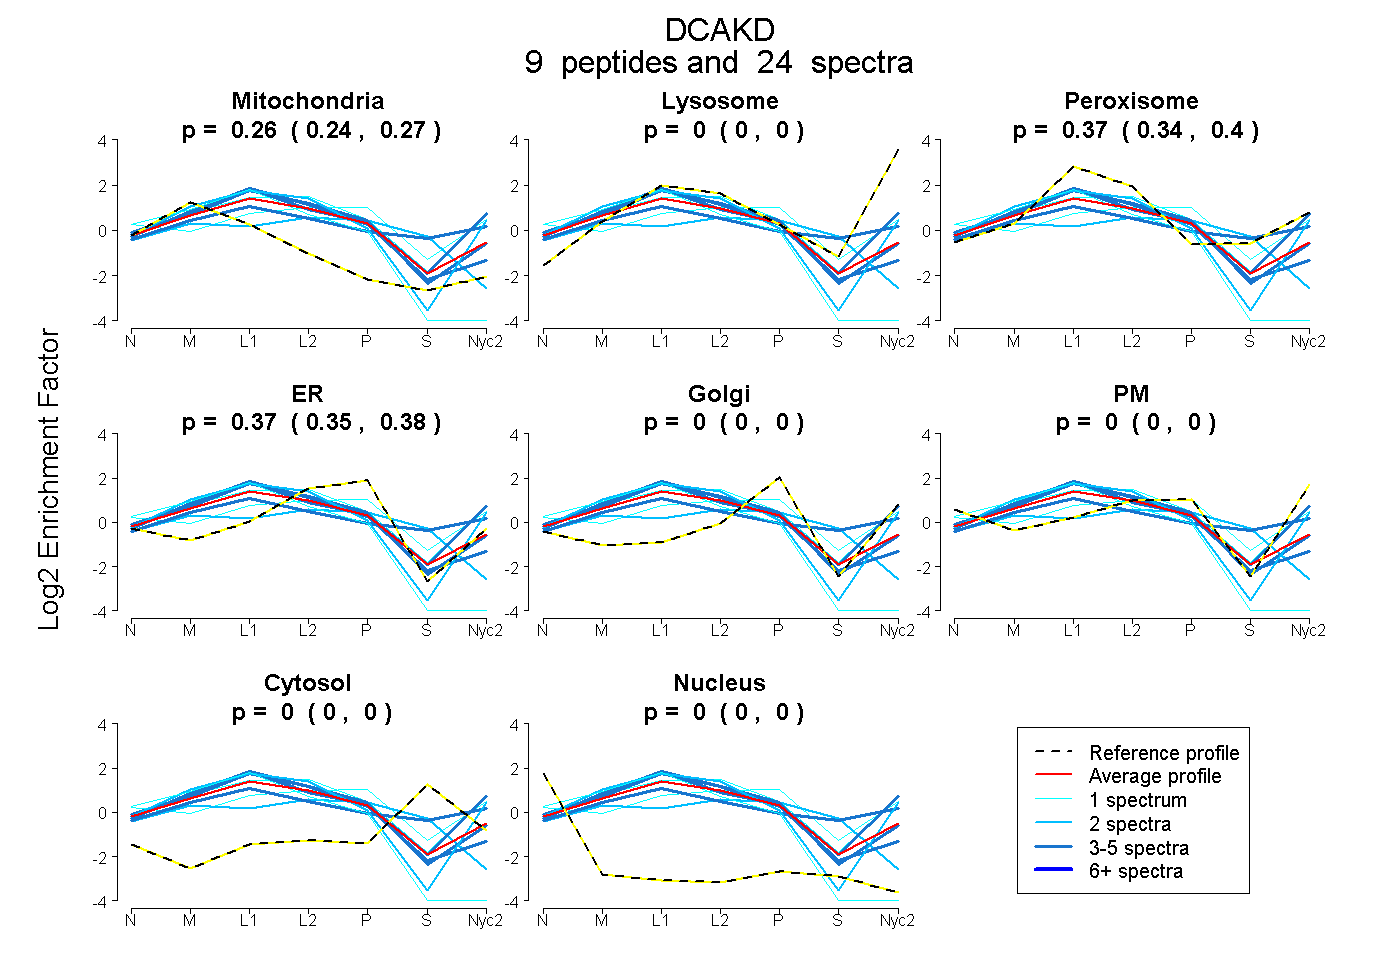
0.240 | 0.274
0.000 | 0.000
0.344 | 0.396
0.351 | 0.383
0.000 | 0.000
0.000 | 0.000
0.000 | 0.000
0.000 | 0.000
1peptide
spectrum
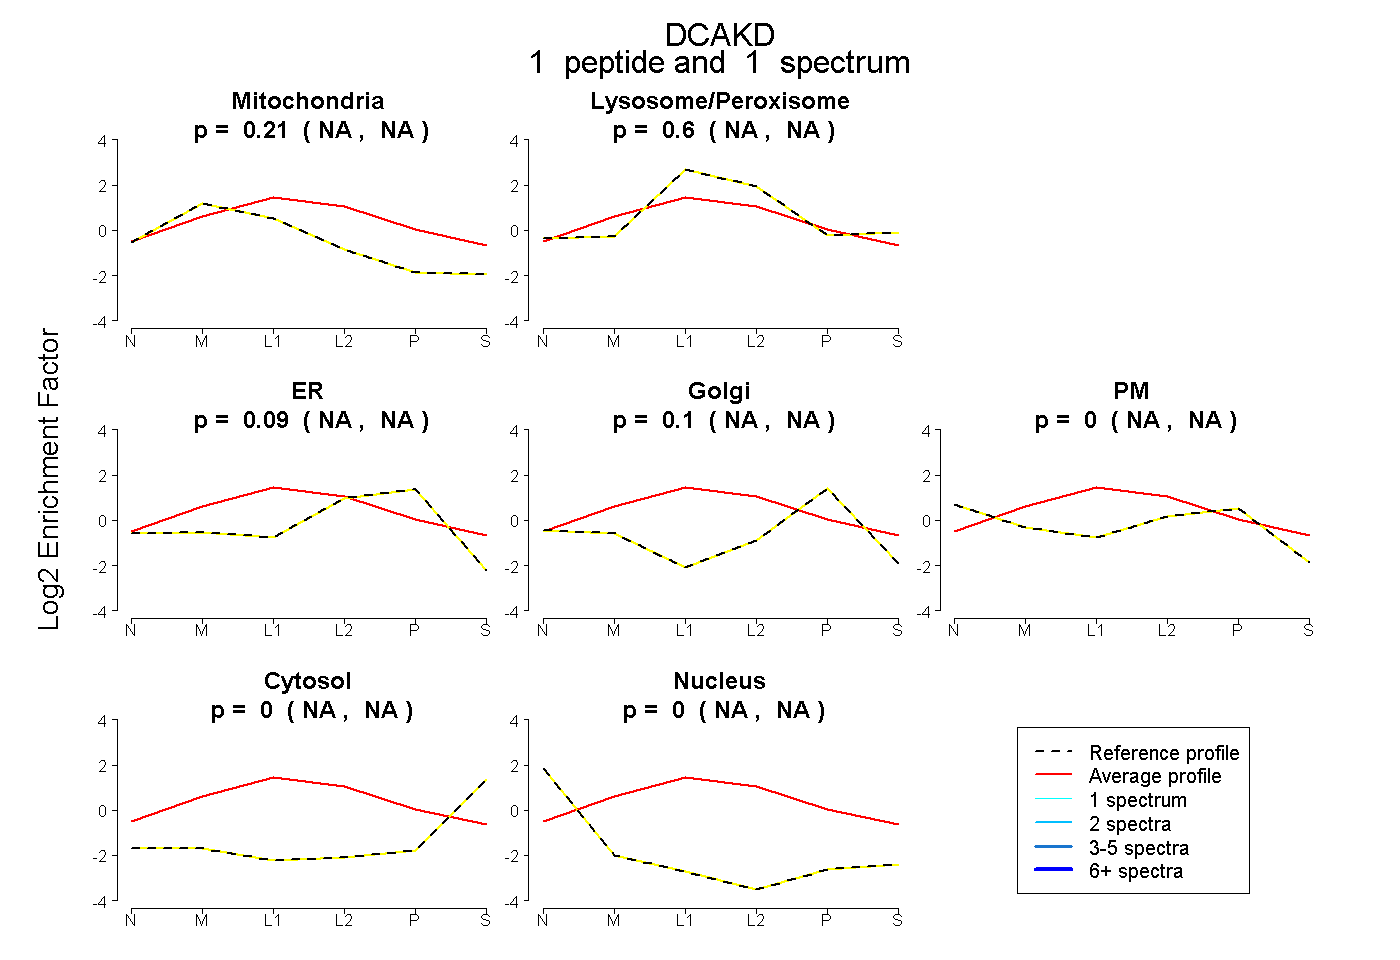
NA | NA
NA | NA
NA | NA
NA | NA
NA | NA
NA | NA
NA | NA
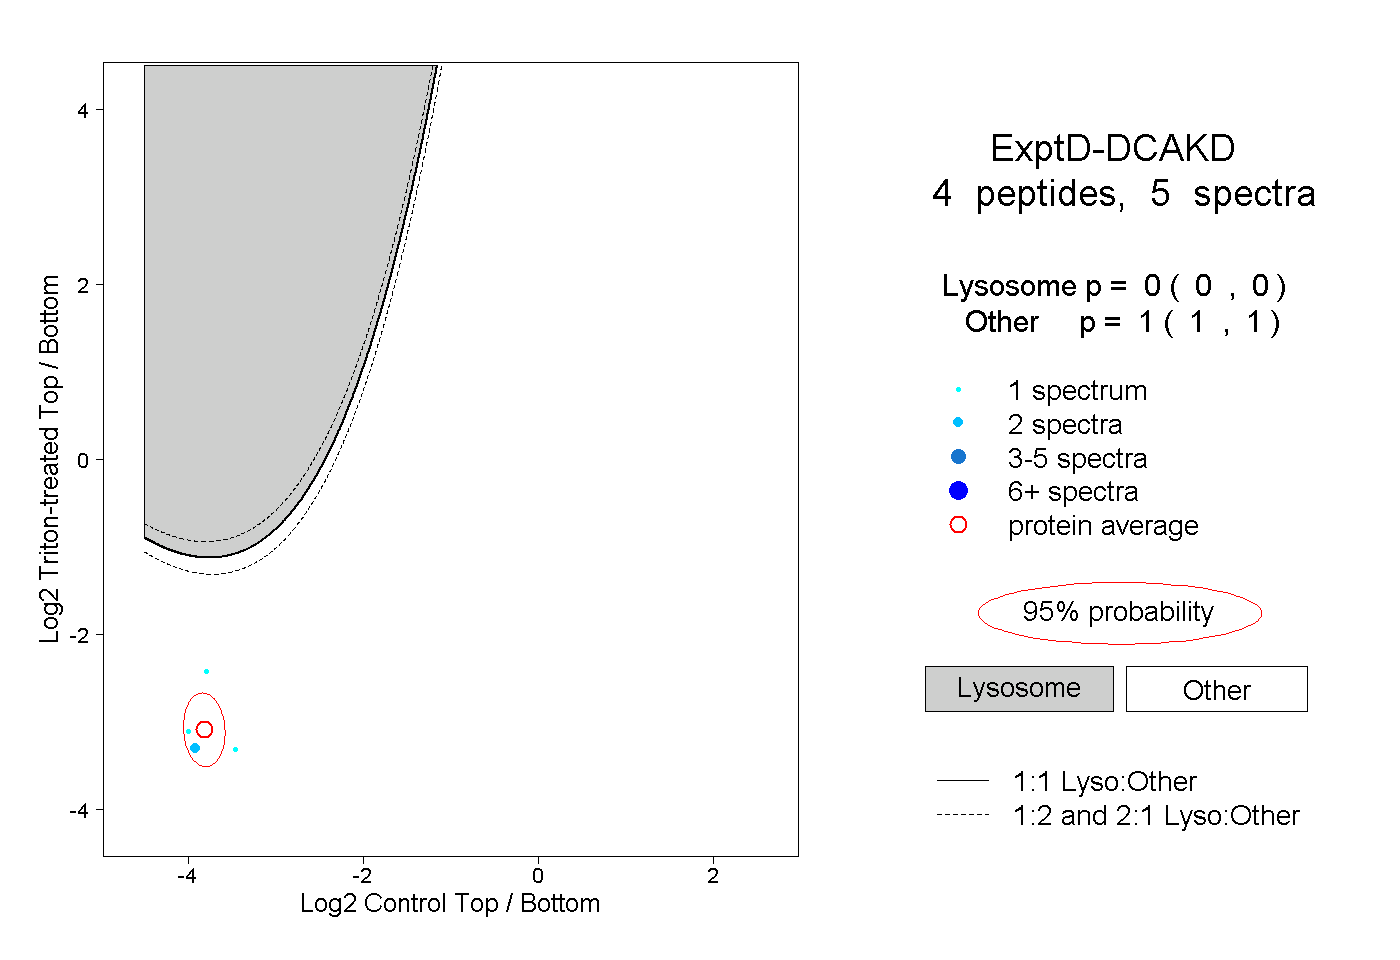
10peptides
spectra
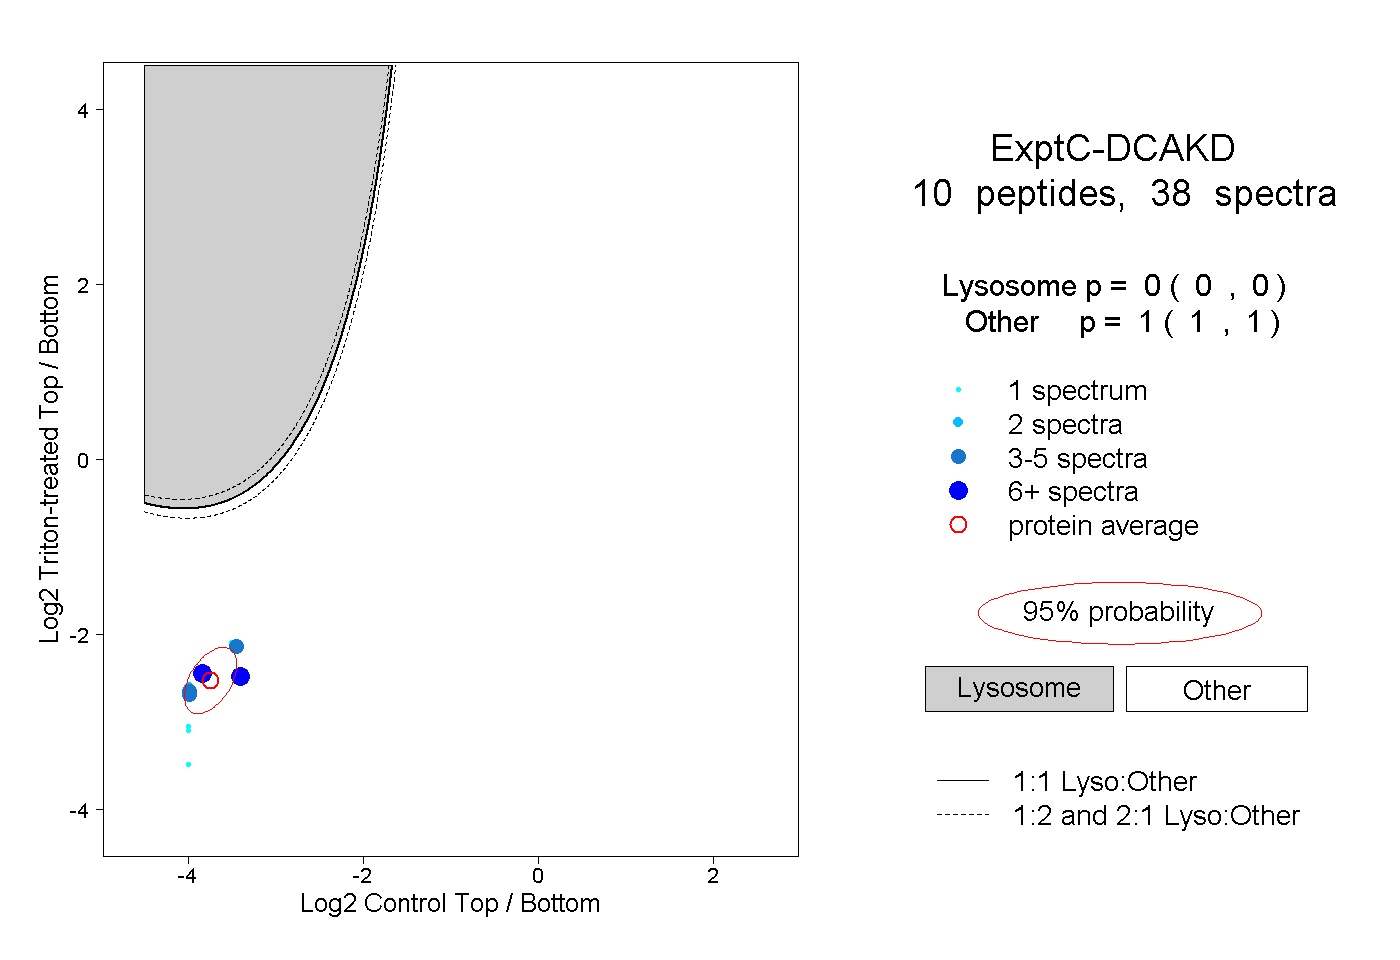
0.000 | 0.000
1.000 | 1.000