8
8peptides
spectra
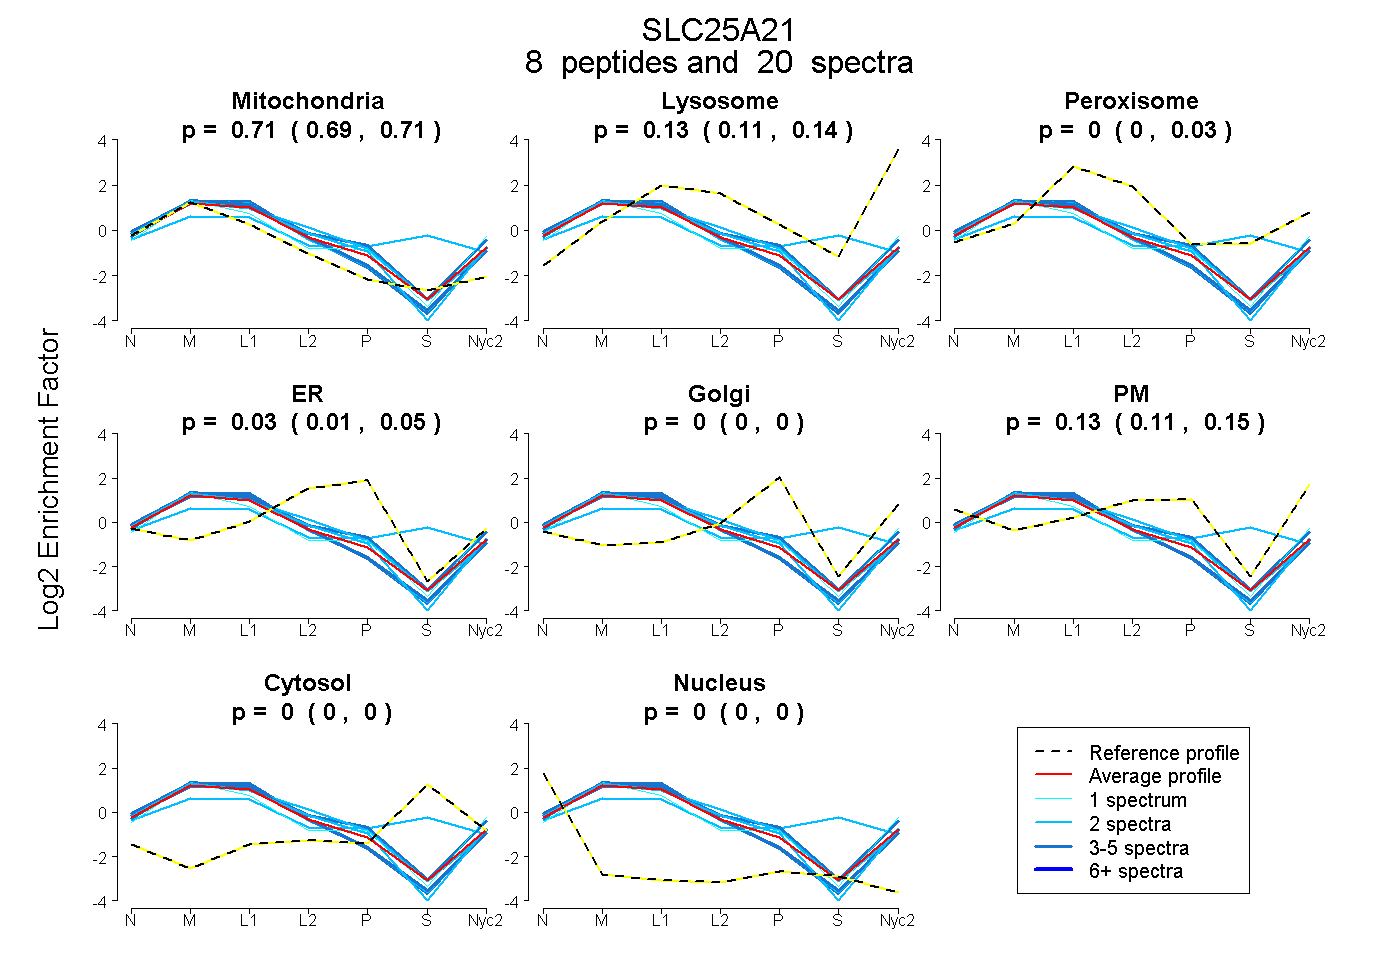
0.693 | 0.714
0.113 | 0.136
0.000 | 0.030
0.011 | 0.045
0.000 | 0.000
0.114 | 0.148
0.000 | 0.000
0.000 | 0.000
4peptides
spectra

0.896 | 0.945
0.039 | 0.076
0.000 | 0.042
0.000 | 0.000
0.000 | 0.000
0.000 | 0.000
0.000 | 0.000
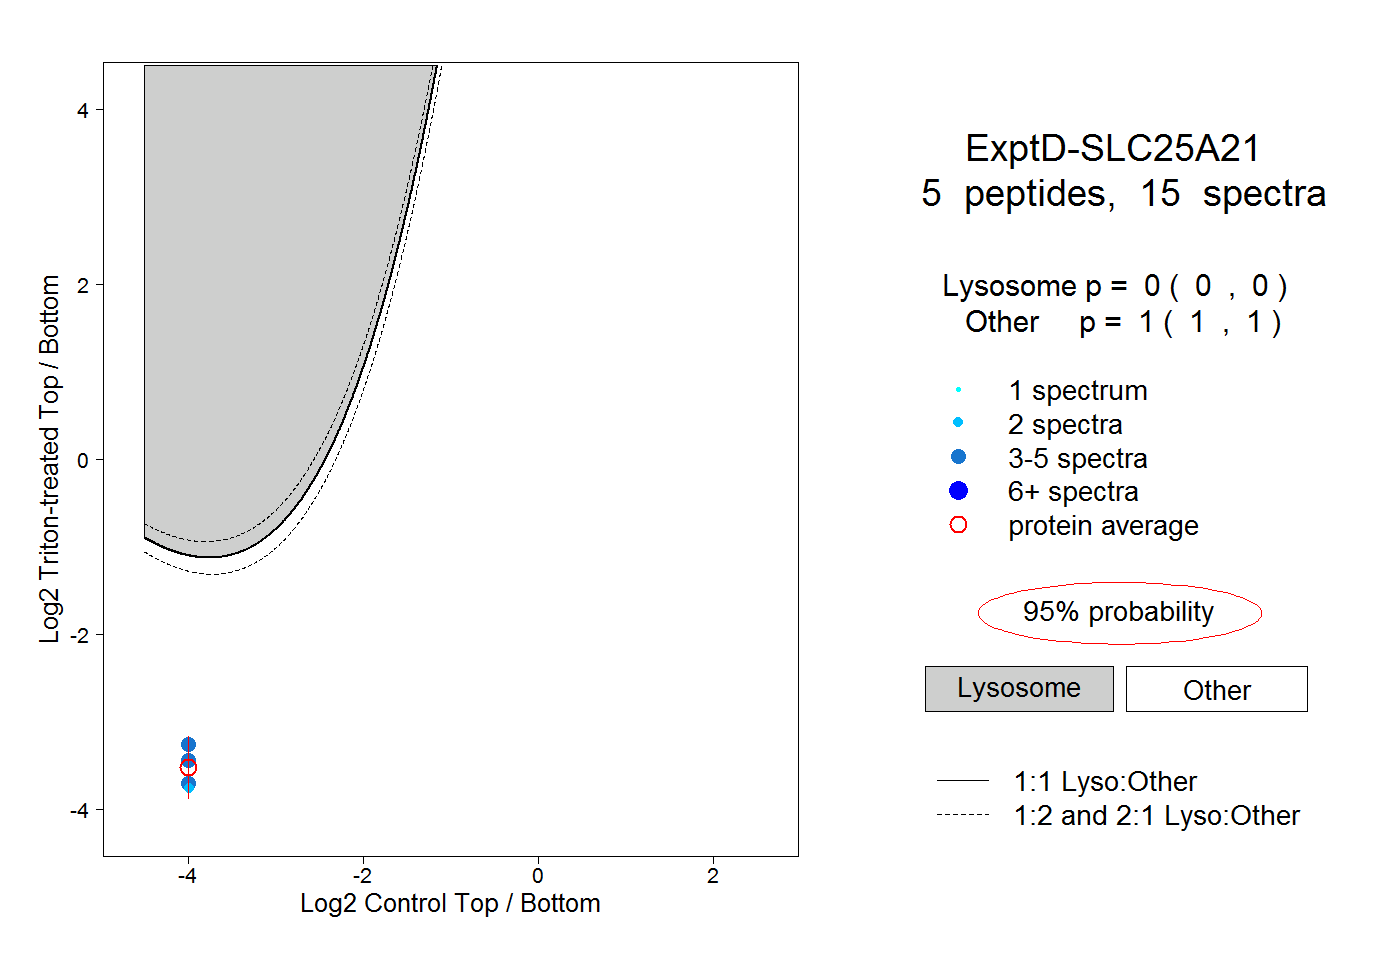
11peptides
spectra

0.000 | 0.000
1.000 | 1.000