 3
3peptides
spectra
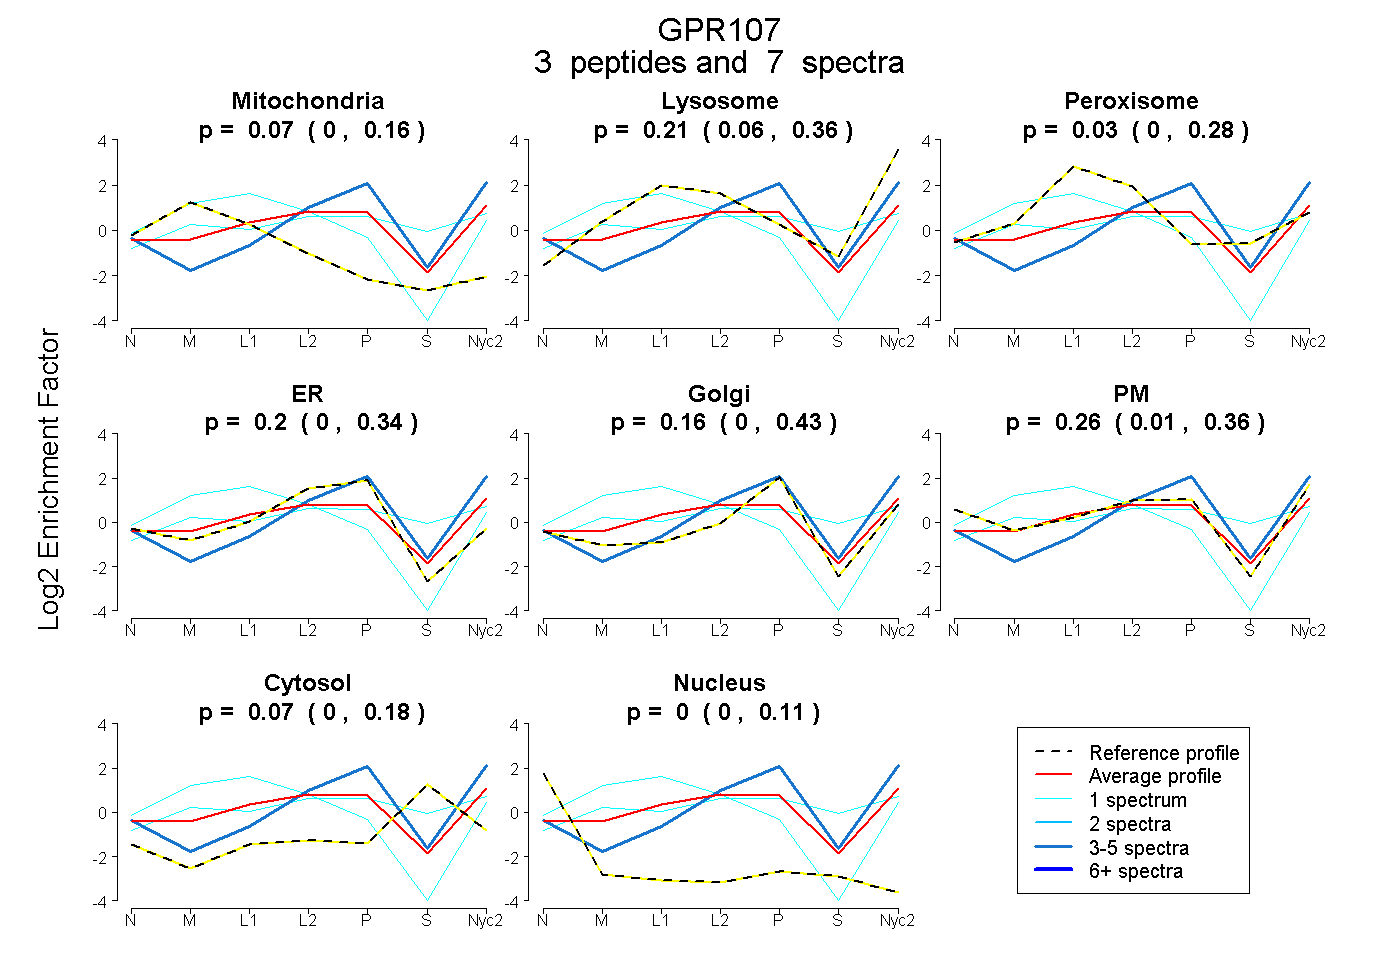
0.000 | 0.157
0.064 | 0.356
0.000 | 0.280
0.000 | 0.342
0.000 | 0.433
0.008 | 0.363
0.000 | 0.181
0.000 | 0.113
9peptides
spectra
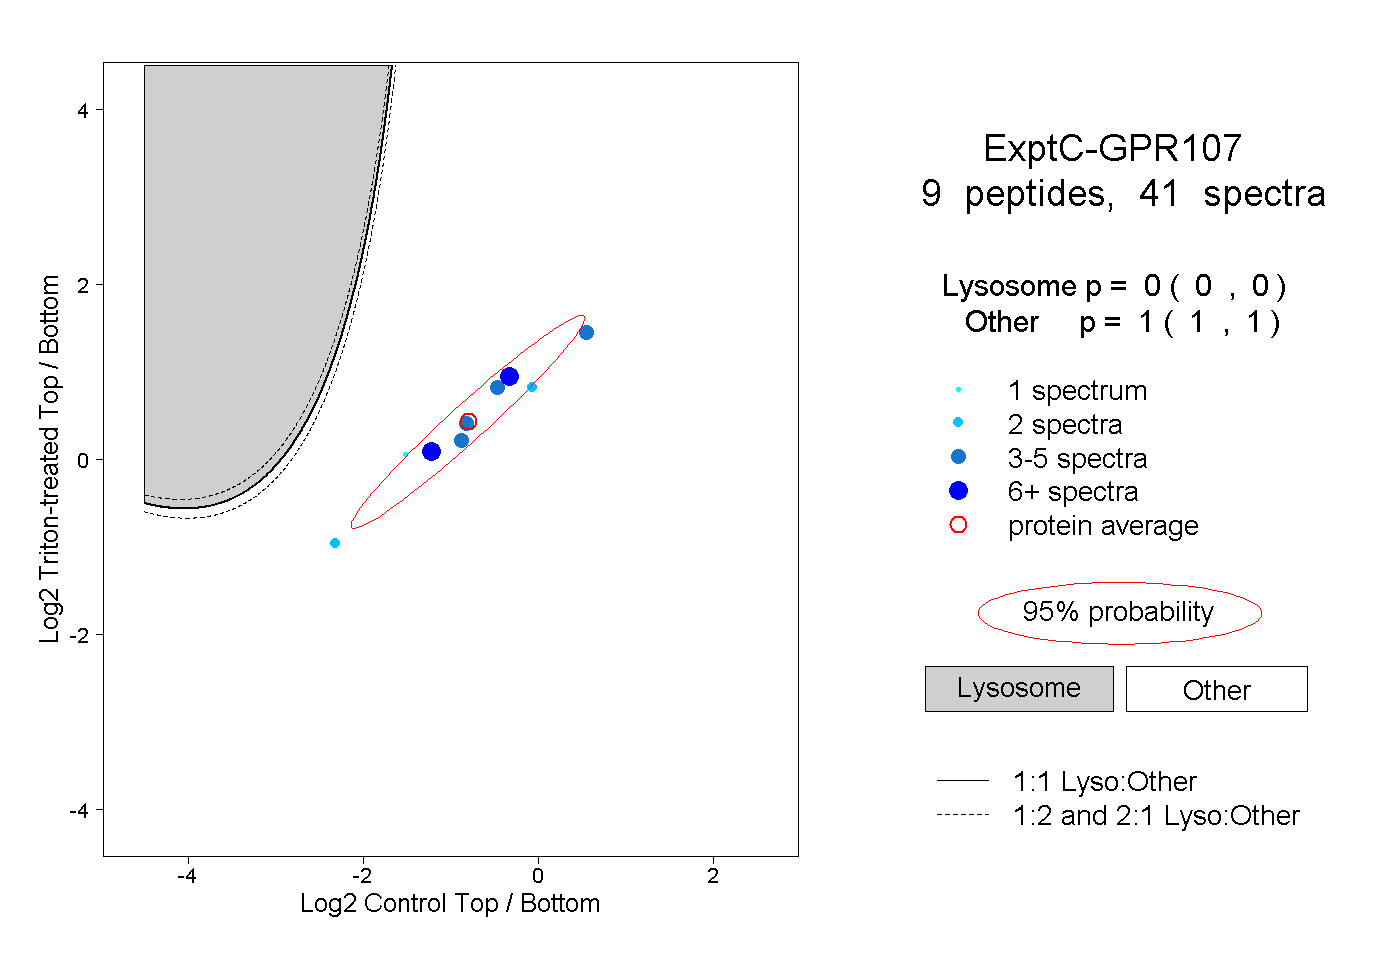
0.000 | 0.000
1.000 | 1.000
1peptide
spectrum
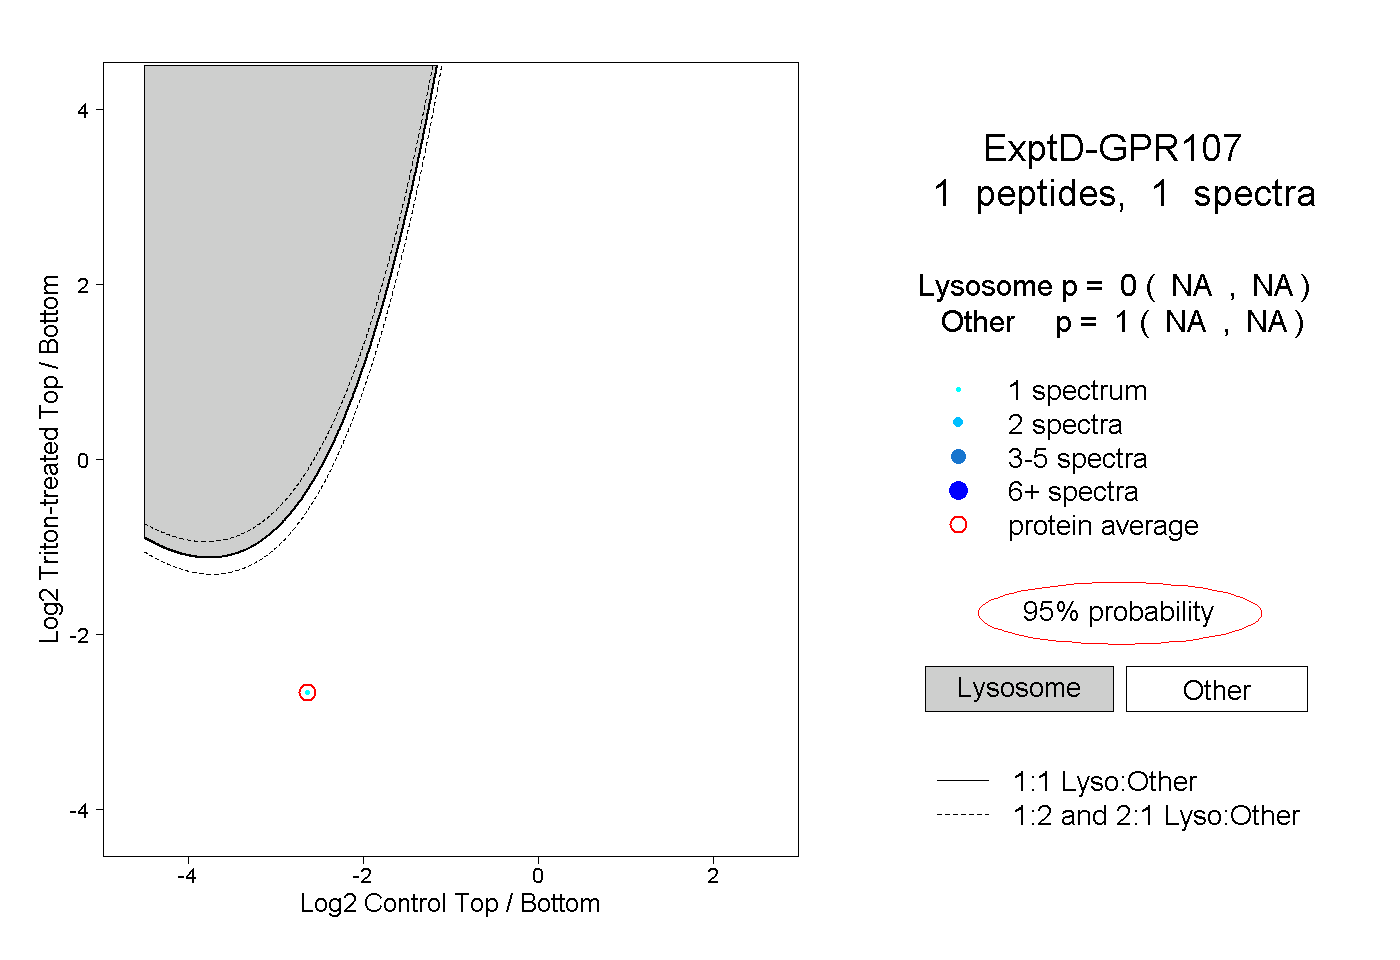
NA | NA
NA | NA