 15
15peptides
spectra
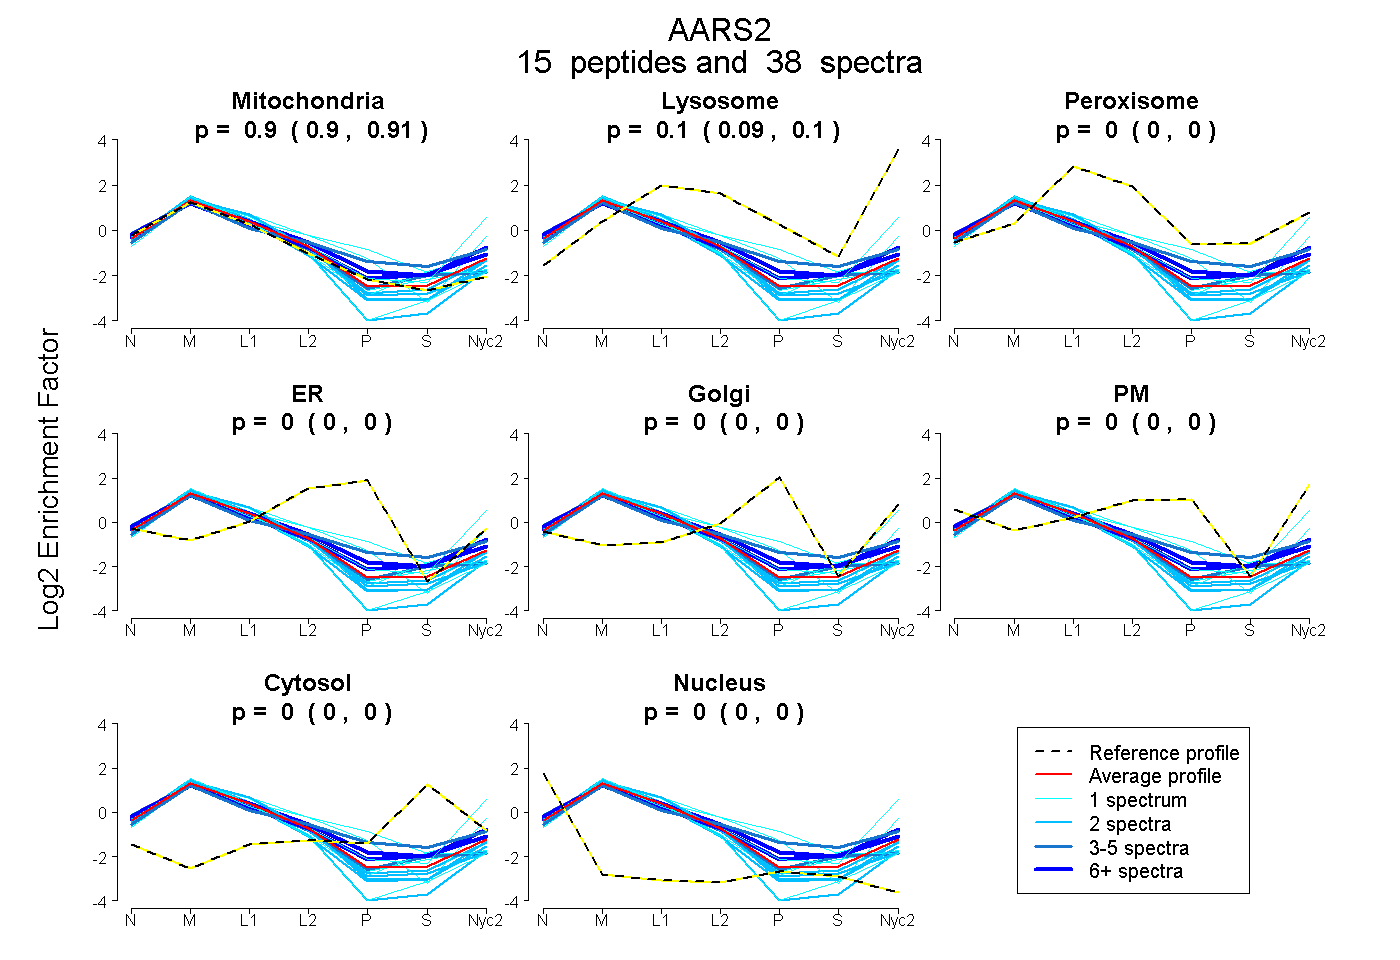
0.896 | 0.908
0.091 | 0.103
0.000 | 0.000
0.000 | 0.000
0.000 | 0.000
0.000 | 0.000
0.000 | 0.000
0.000 | 0.000
5peptides
spectra
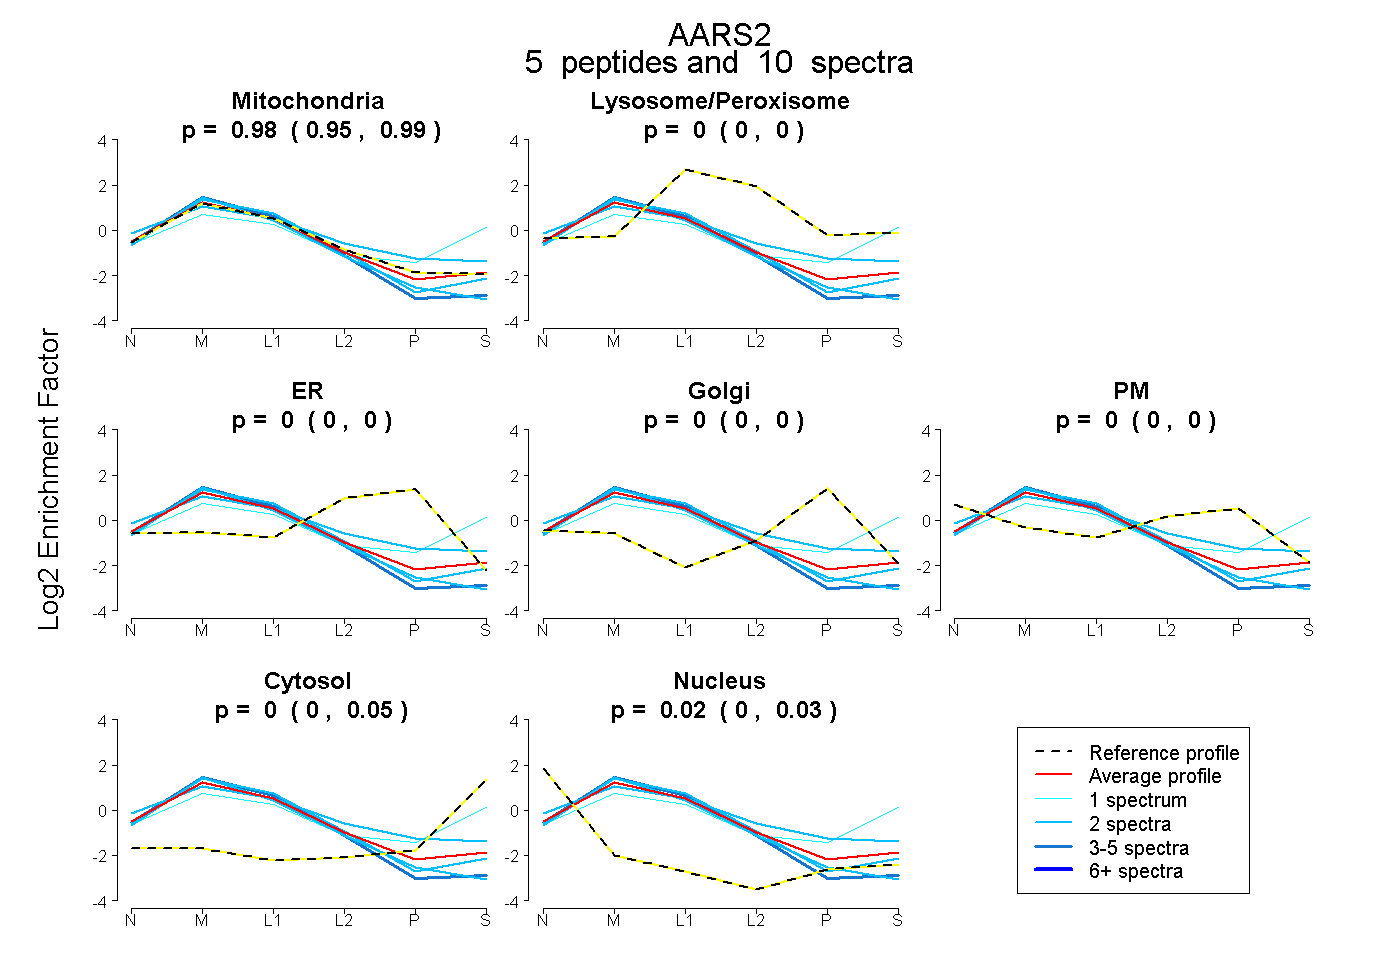
0.947 | 0.990
0.000 | 0.000
0.000 | 0.000
0.000 | 0.000
0.000 | 0.000
0.000 | 0.046
0.000 | 0.028
23peptides
spectra
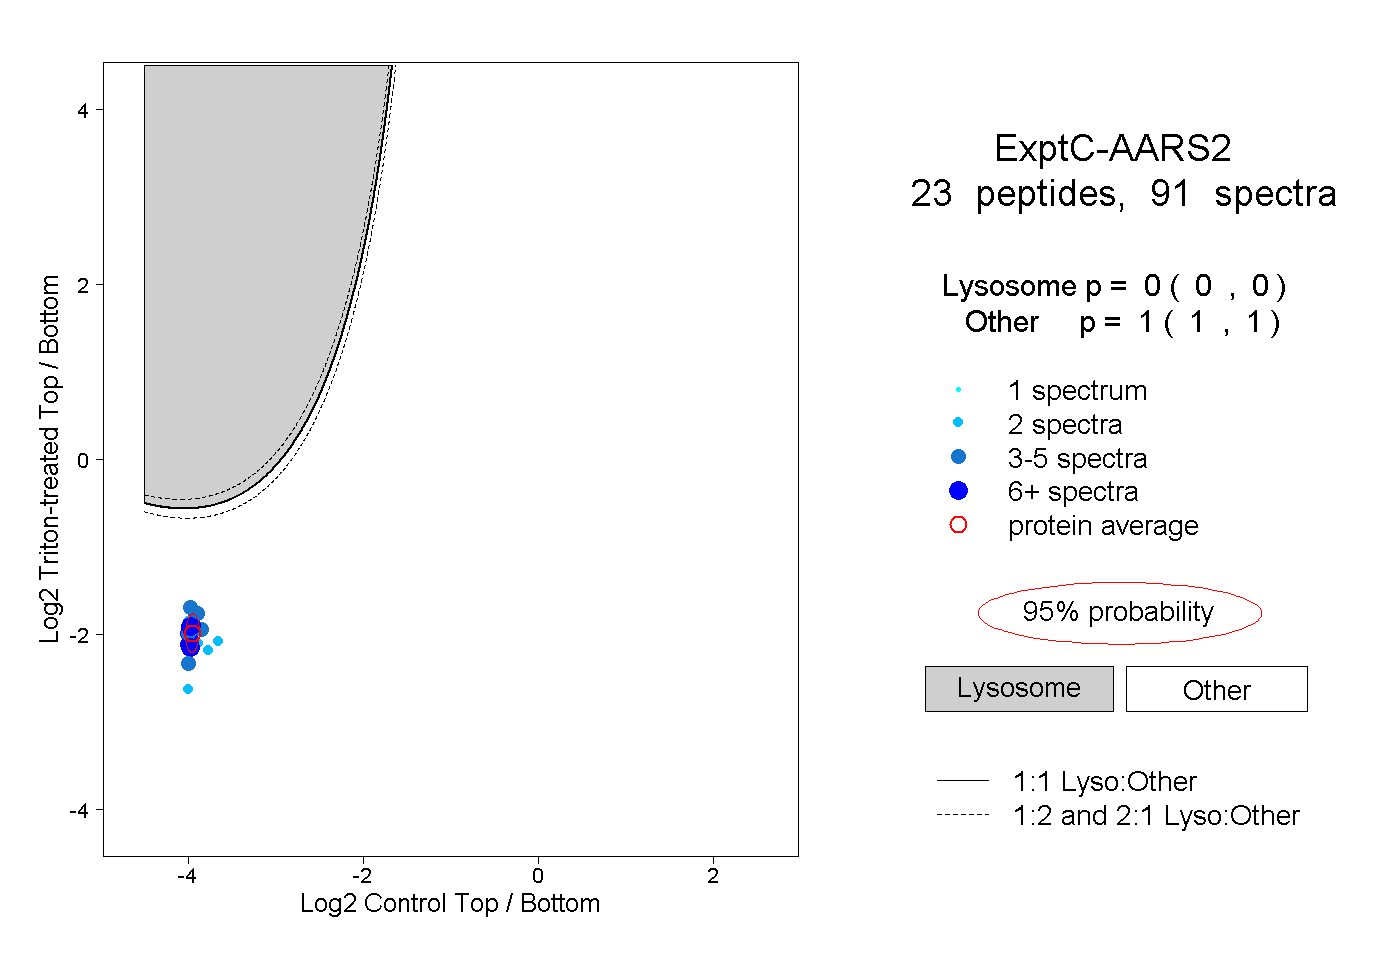
0.000 | 0.000
1.000 | 1.000
7peptides
spectra
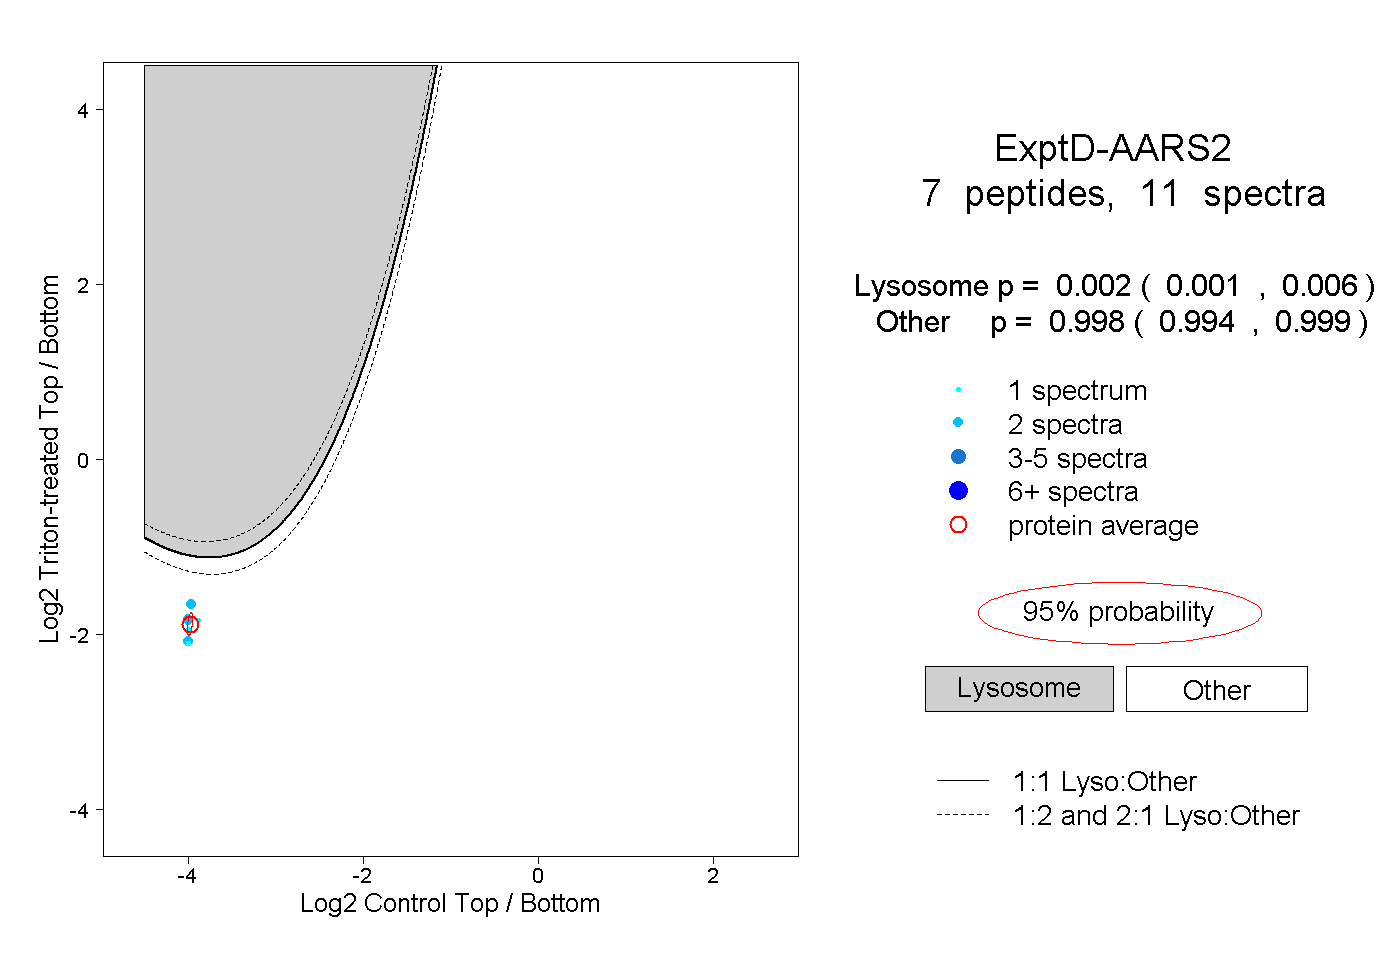
0.001 | 0.006
0.994 | 0.999