 2
2peptides
spectra

0.000 | 0.040
0.000 | 0.025
0.000 | 0.113
0.000 | 0.354
0.000 | 0.257
0.000 | 0.346
0.432 | 0.723
0.000 | 0.156
1peptide
spectrum
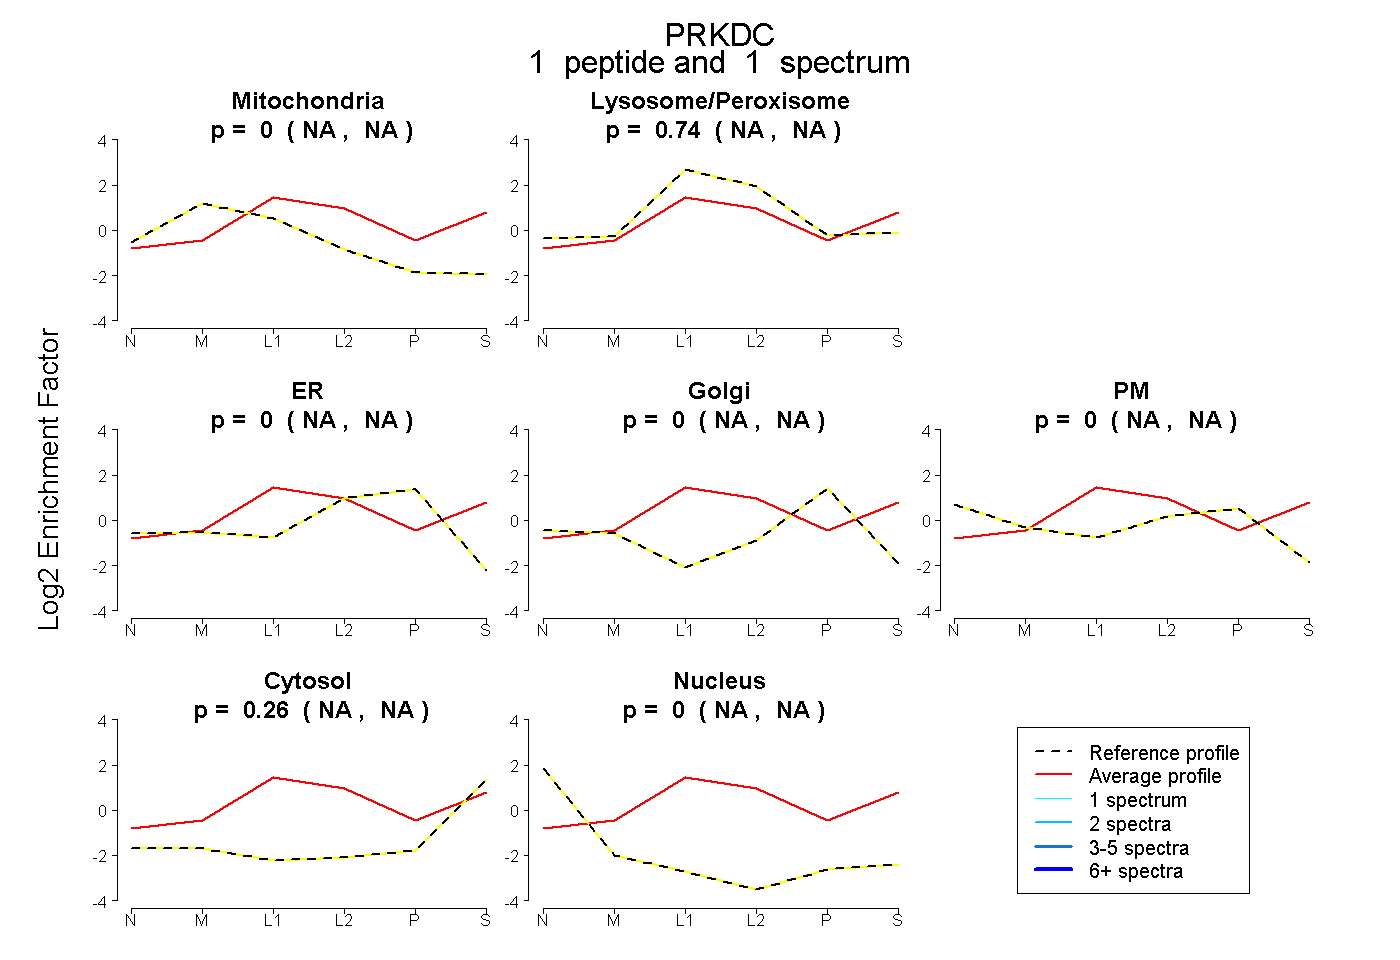
NA | NA
NA | NA
NA | NA
NA | NA
NA | NA
NA | NA
NA | NA
6peptides
spectra
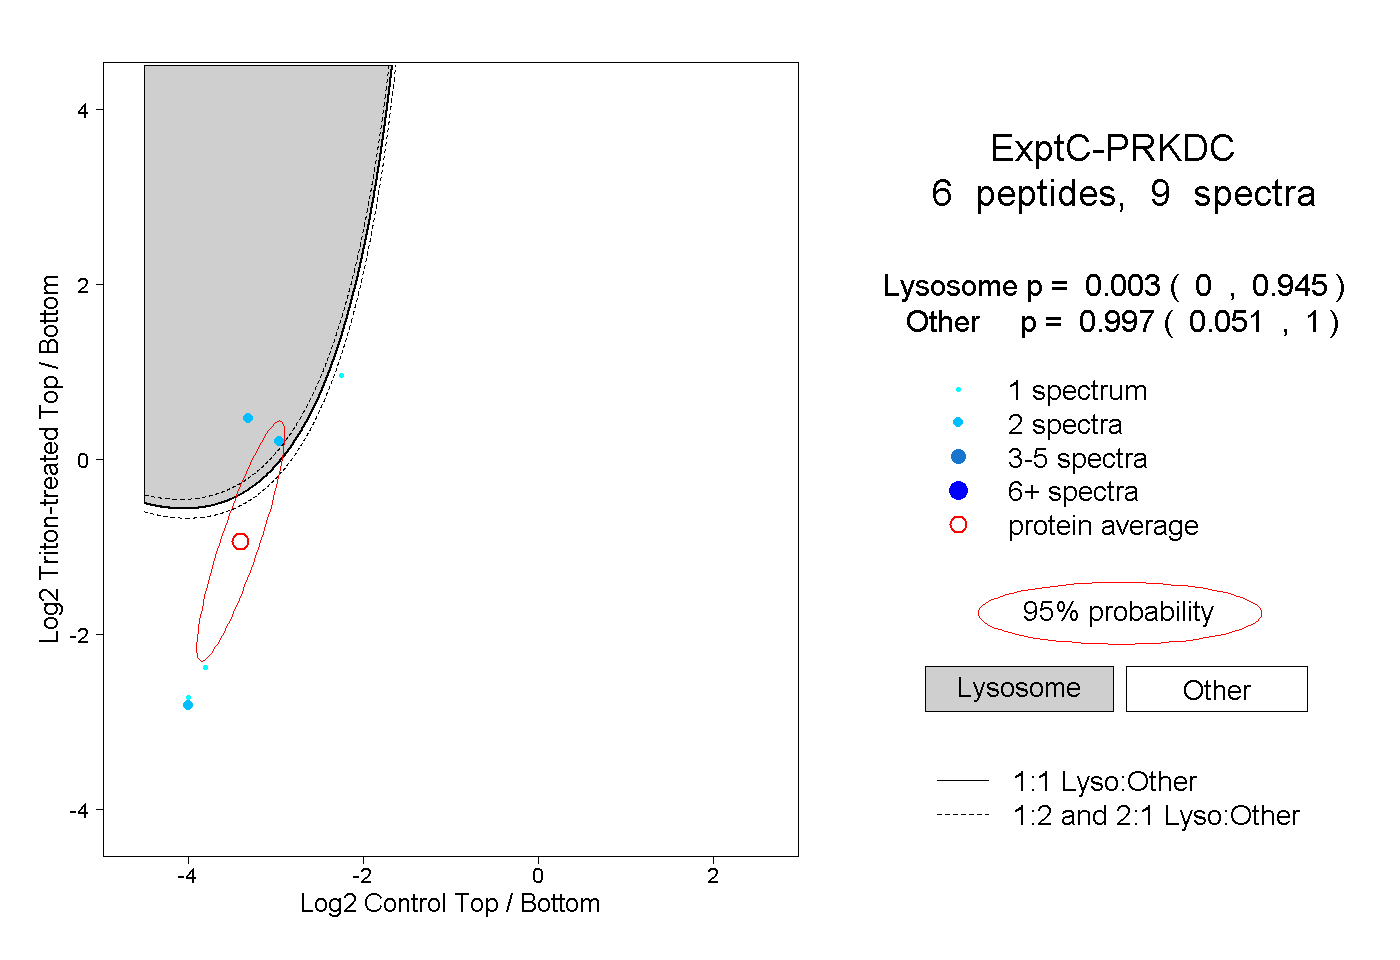
0.000 | 0.945
0.051 | 1.000