 7
7peptides
spectra
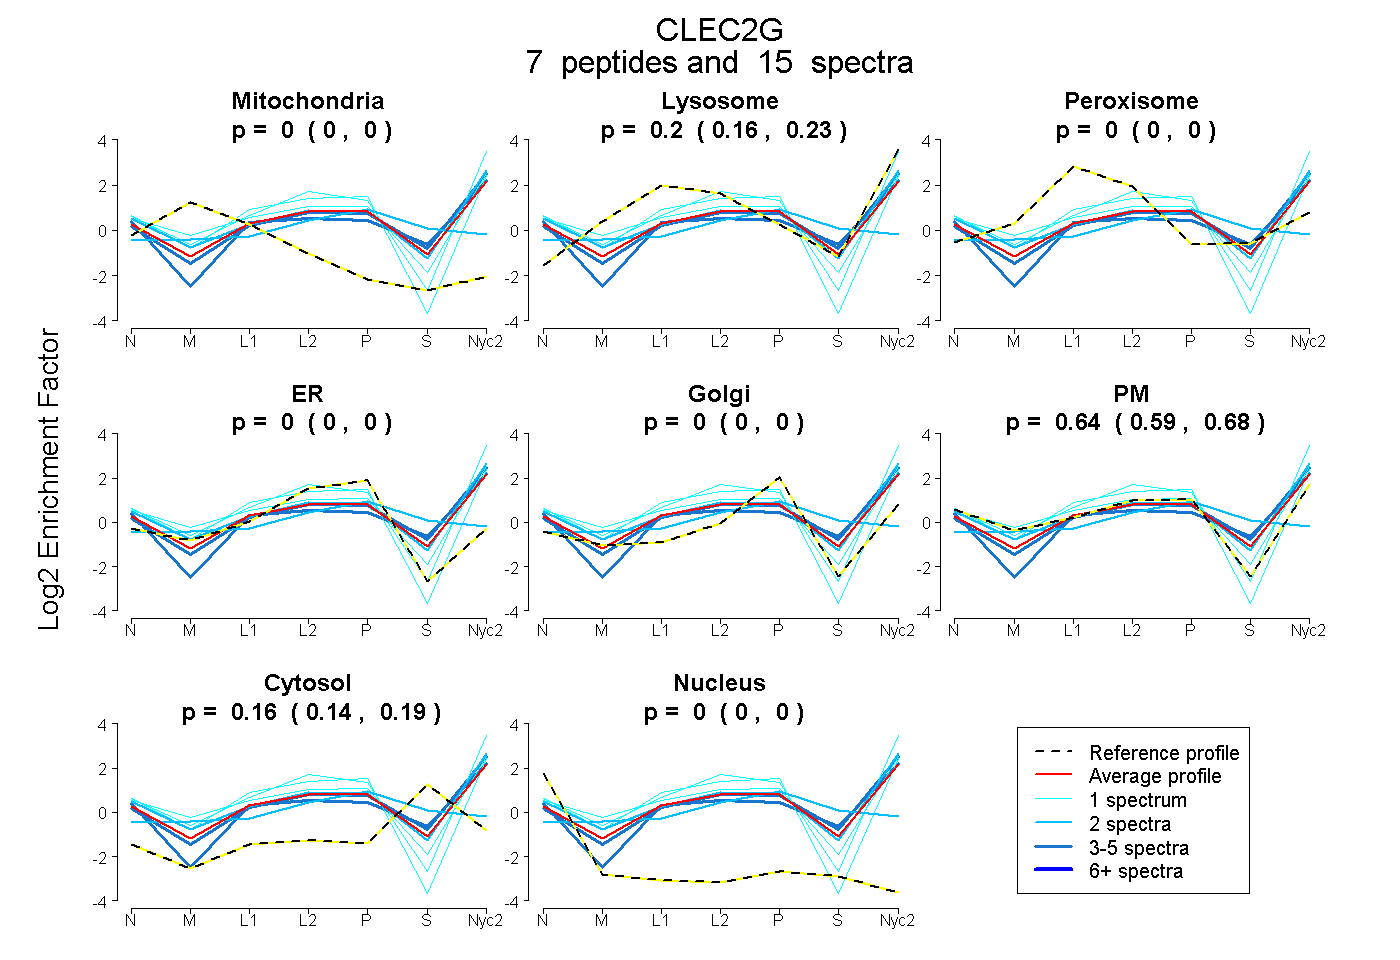
0.000 | 0.000
0.156 | 0.233
0.000 | 0.000
0.000 | 0.000
0.000 | 0.000
0.591 | 0.679
0.135 | 0.187
0.000 | 0.000
1peptide
spectrum
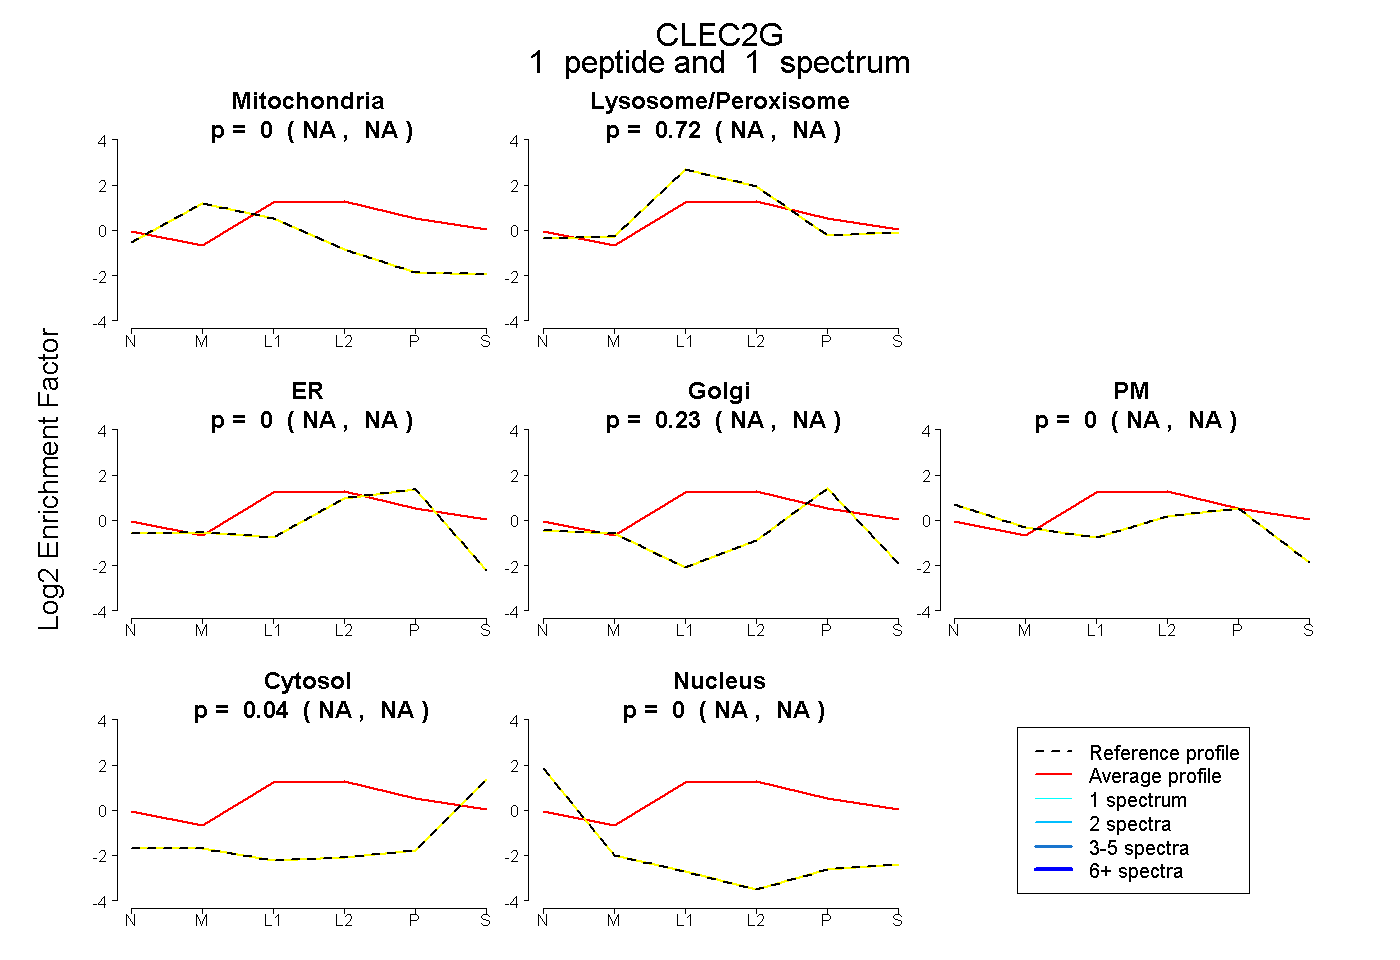
NA | NA
NA | NA
NA | NA
NA | NA
NA | NA
NA | NA
NA | NA
10peptides
spectra
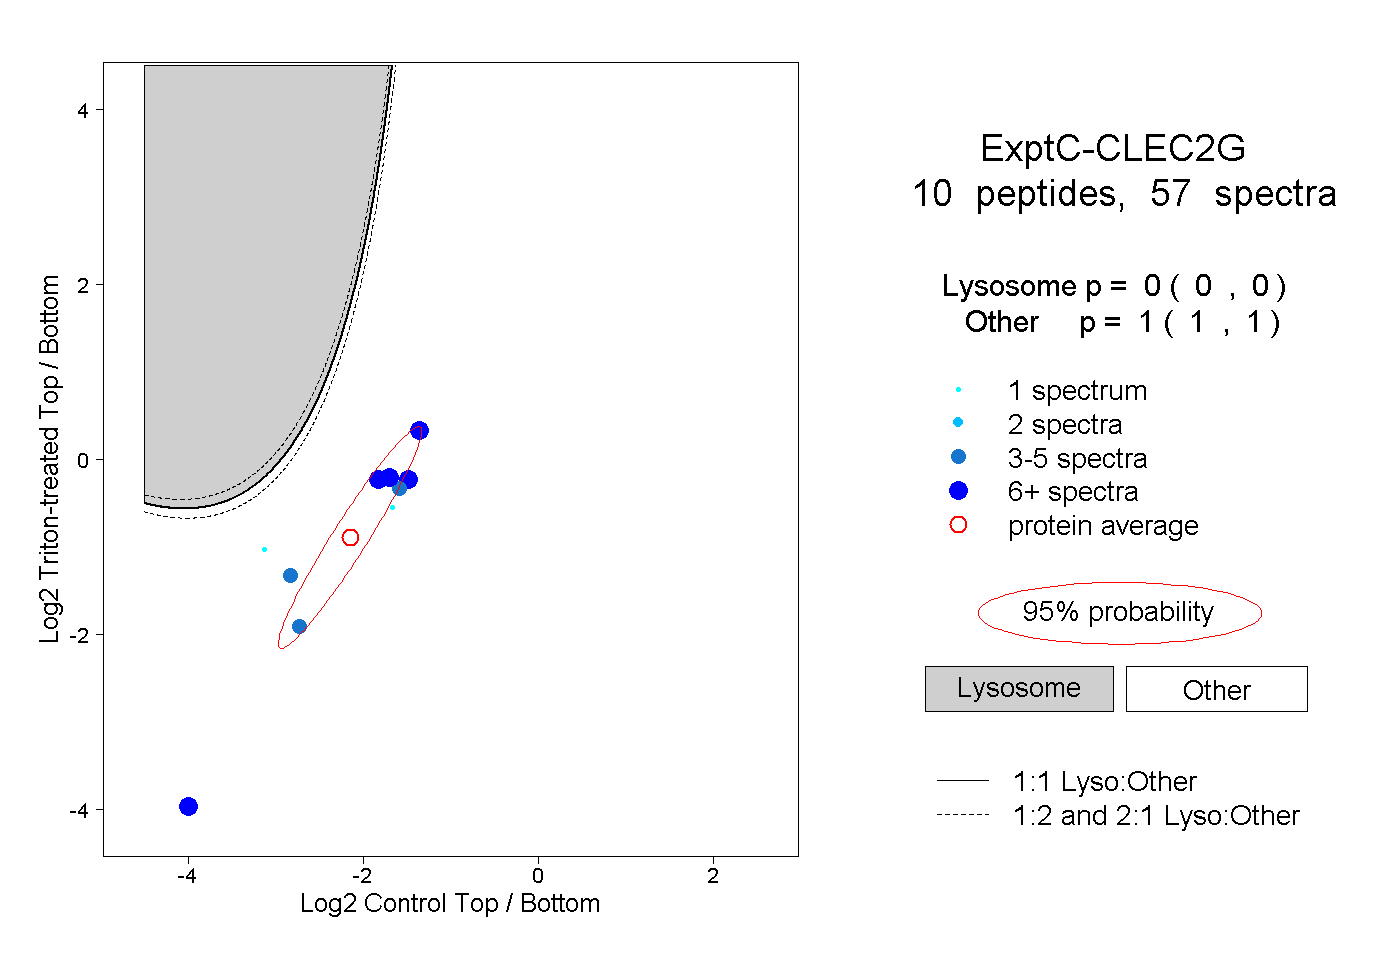
0.000 | 0.000
1.000 | 1.000
7peptides
spectra
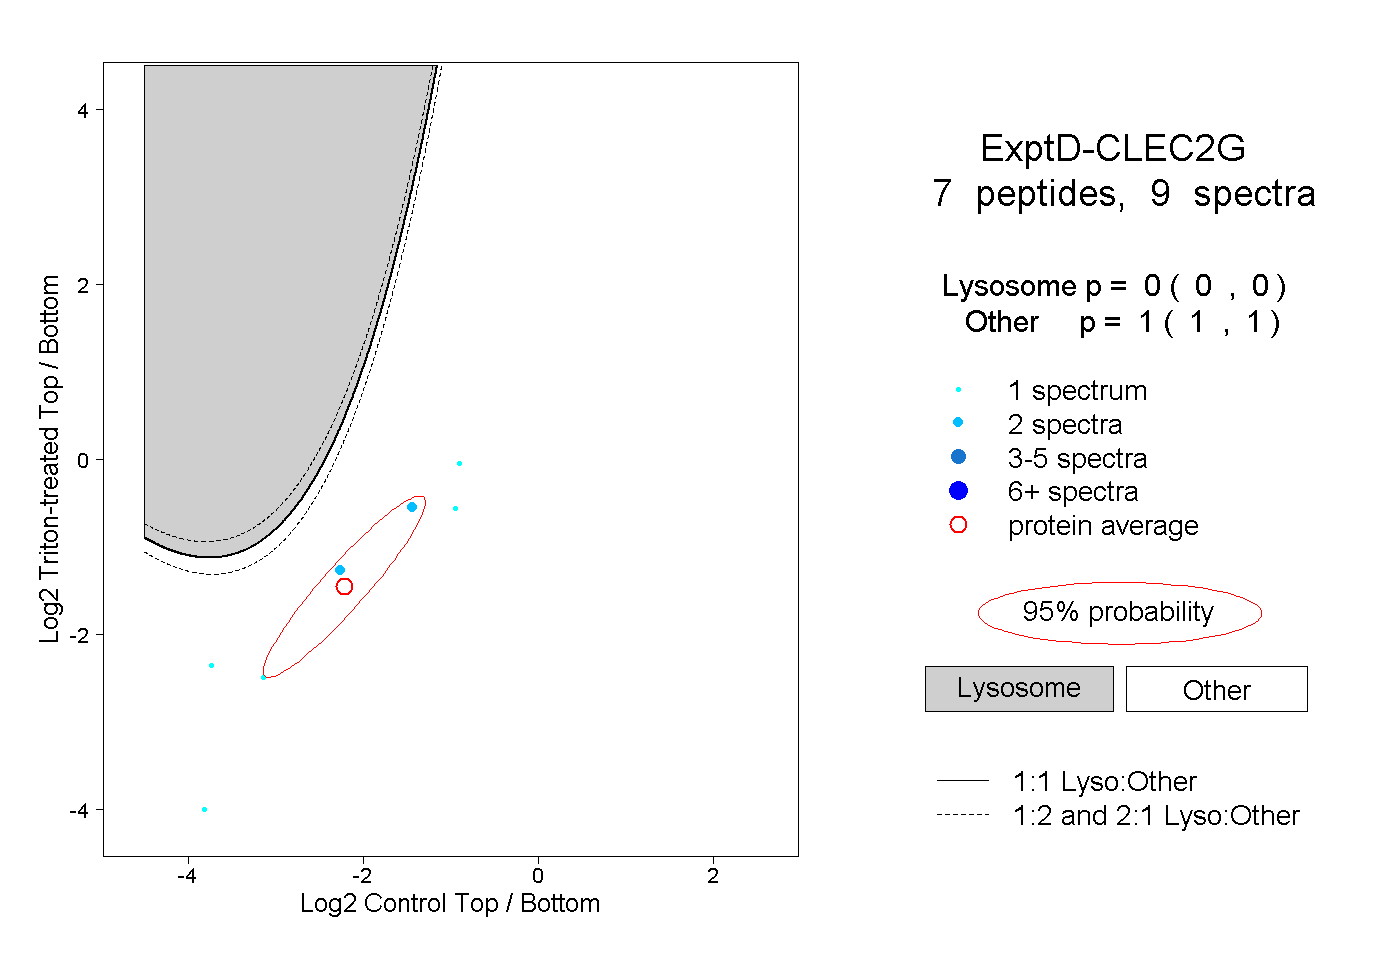
0.000 | 0.000
1.000 | 1.000