 7
7peptides
spectra
0.000 | 0.000
0.156 | 0.233
0.000 | 0.000
0.000 | 0.000
0.000 | 0.000
0.591 | 0.679
0.135 | 0.187
0.000 | 0.000
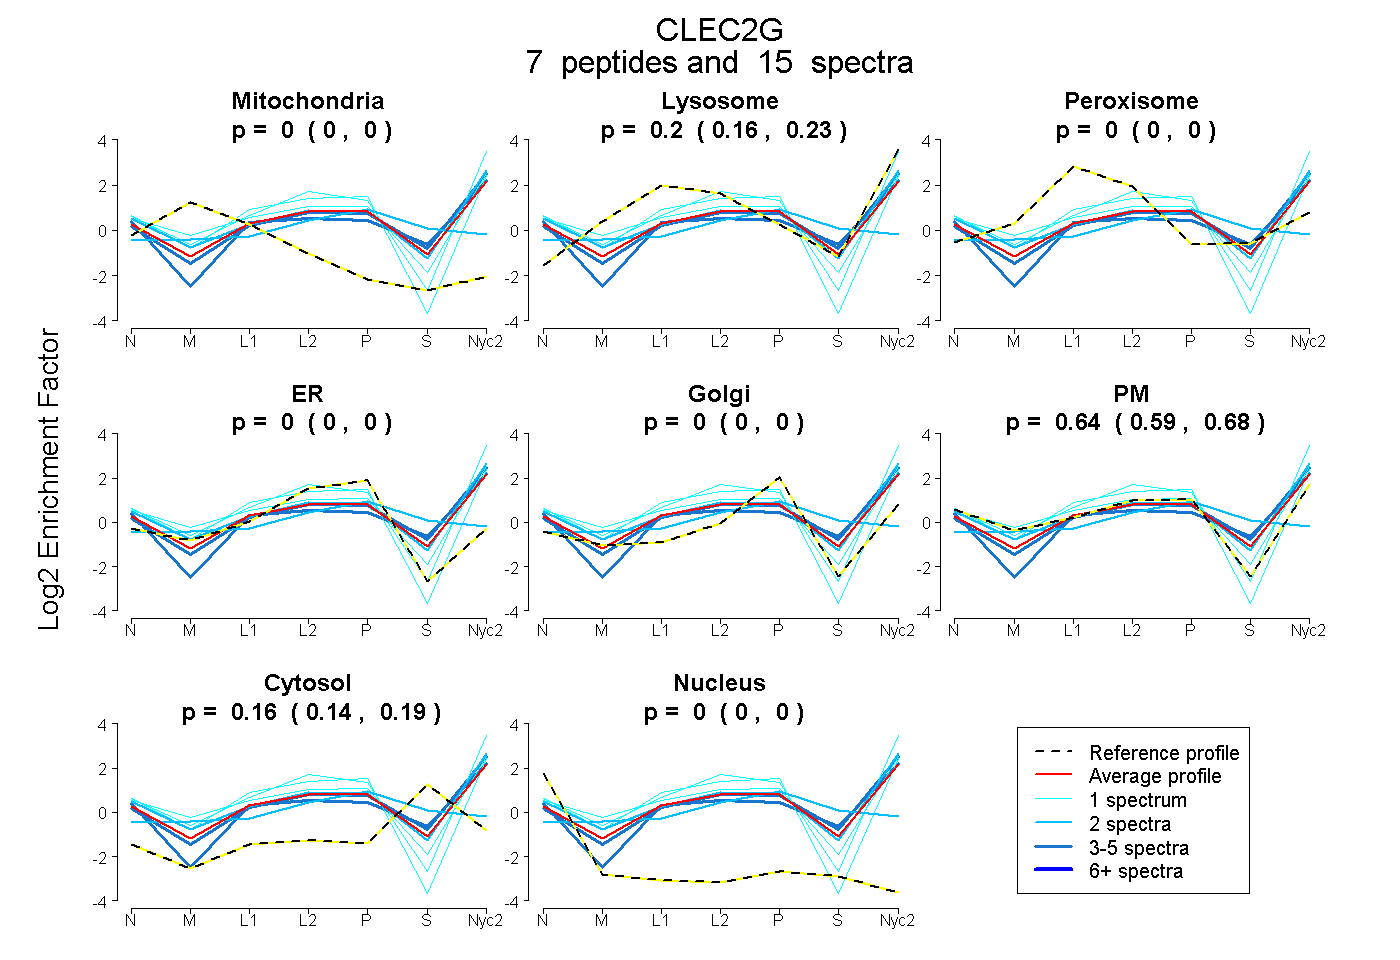
| Plot | Mito | Lyso | Perox | ER | Golgi | PM | Cytosol | Nucleus | |||||
| Expt A |
7 peptides |
15 spectra |
|
0.000 0.000 | 0.000 |
0.198 0.156 | 0.233 |
0.000 0.000 | 0.000 |
0.000 0.000 | 0.000 |
0.000 0.000 | 0.000 |
0.638 0.591 | 0.679 |
0.164 0.135 | 0.187 |
0.000 0.000 | 0.000 |
| 4 spectra, AQEAELAR | 0.000 | 0.265 | 0.000 | 0.000 | 0.000 | 0.539 | 0.196 | 0.000 | ||
| 2 spectra, NWIGVGNK | 0.000 | 0.232 | 0.000 | 0.000 | 0.000 | 0.684 | 0.084 | 0.000 | ||
| 1 spectrum, LNSYSLQCK | 0.000 | 0.030 | 0.000 | 0.000 | 0.000 | 0.970 | 0.000 | 0.000 | ||
| 1 spectrum, FDTEEELNFLSR | 0.000 | 0.266 | 0.000 | 0.000 | 0.000 | 0.734 | 0.000 | 0.000 | ||
| 2 spectra, MTPQISTINTYAACPR | 0.000 | 0.000 | 0.230 | 0.239 | 0.200 | 0.000 | 0.331 | 0.000 | ||
| 4 spectra, GSFDYWIGLHR | 0.000 | 0.164 | 0.000 | 0.000 | 0.000 | 0.539 | 0.298 | 0.000 | ||
| 1 spectrum, IVSPESPAK | 0.000 | 0.215 | 0.000 | 0.000 | 0.000 | 0.785 | 0.000 | 0.000 |
| Plot | Mito | Lyso or Perox | ER | Golgi | PM | Cytosol | Nucleus | ||||||
| Expt B |
1 peptide |
1 spectrum |
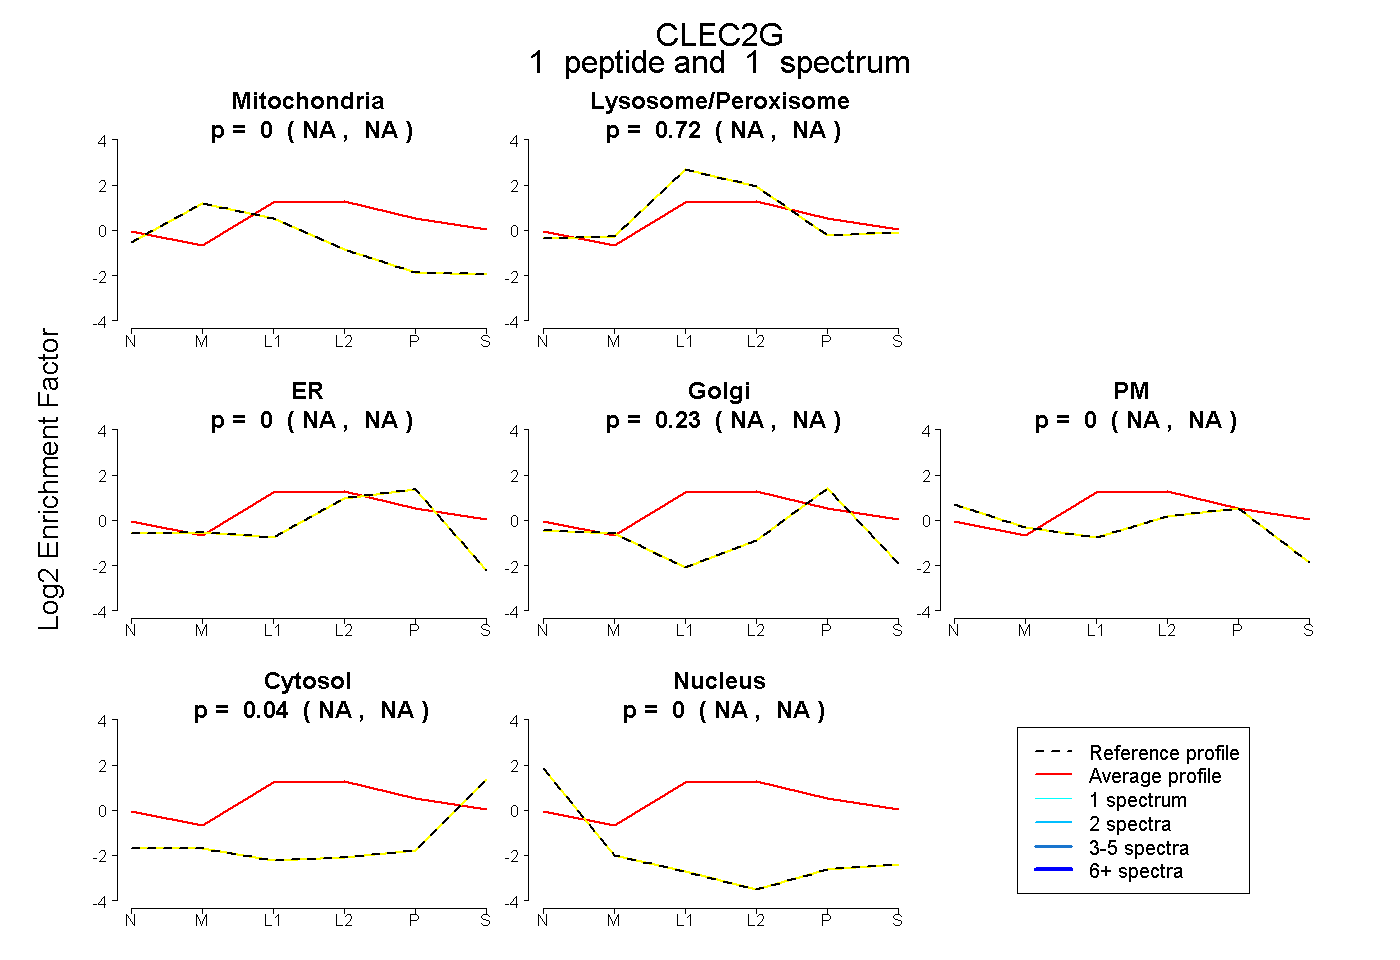 |
0.000 NA | NA |
0.720 NA | NA |
0.000 NA | NA |
0.233 NA | NA |
0.005 NA | NA |
0.042 NA | NA |
0.000 NA | NA |
|||
| Plot | Lyso | Other | |||||||||||
| Expt C |
10 peptides |
57 spectra |
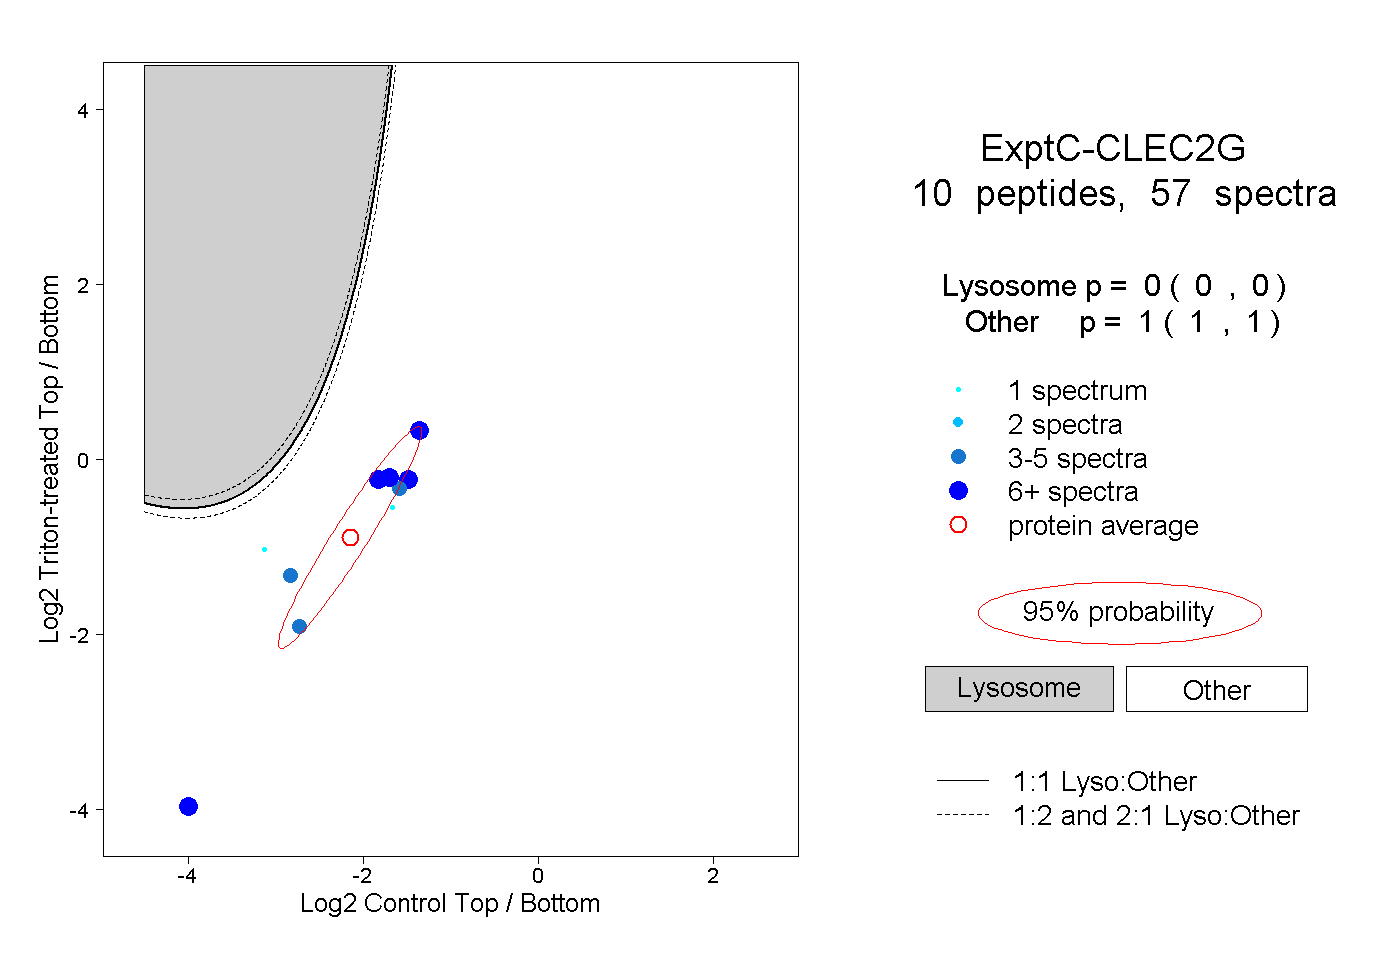 |
0.000 0.000 | 0.000 |
1.000 1.000 | 1.000 |
||||||||
| Plot | Lyso | Other | |||||||||||
| Expt D |
7 peptides |
9 spectra |
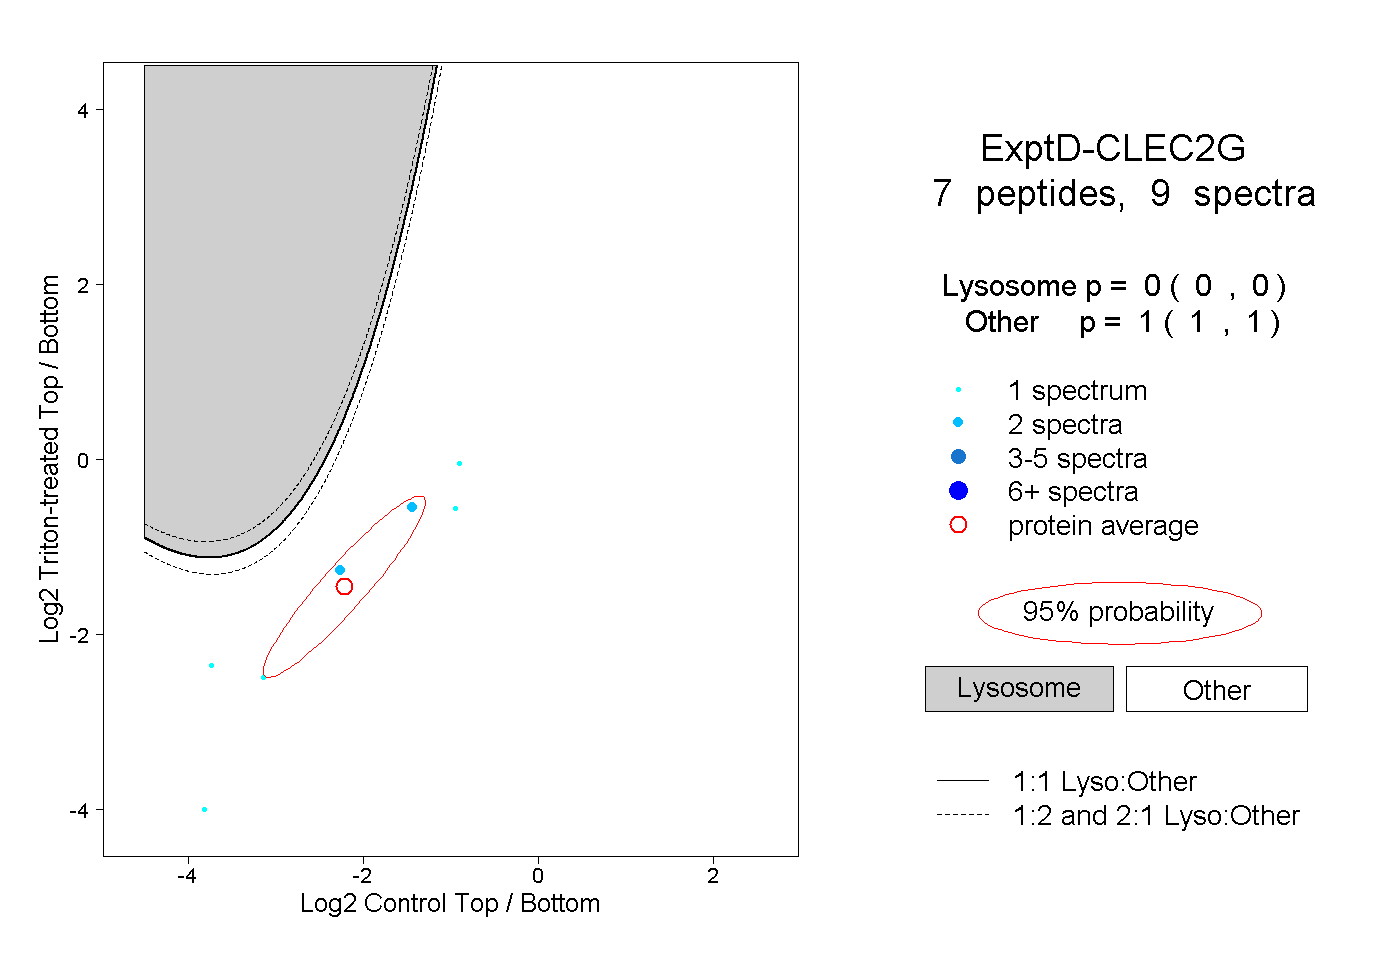 |
0.000 0.000 | 0.000 |
1.000 1.000 | 1.000 |