4
4peptides
spectra
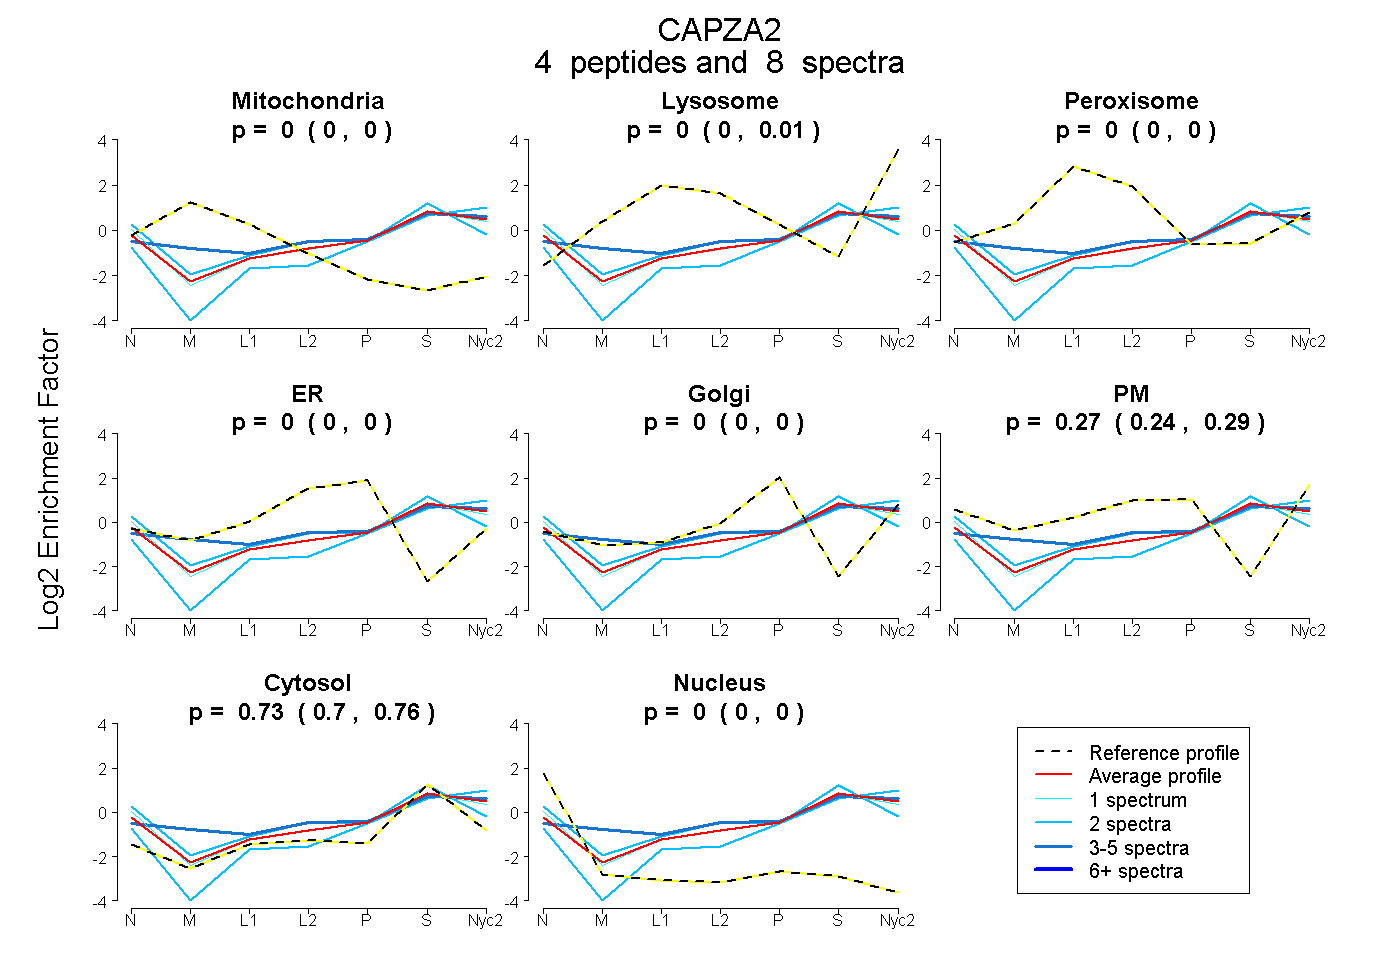
0.000 | 0.000
0.000 | 0.013
0.000 | 0.000
0.000 | 0.000
0.000 | 0.000
0.237 | 0.289
0.703 | 0.758
0.000 | 0.000
7peptides
spectra
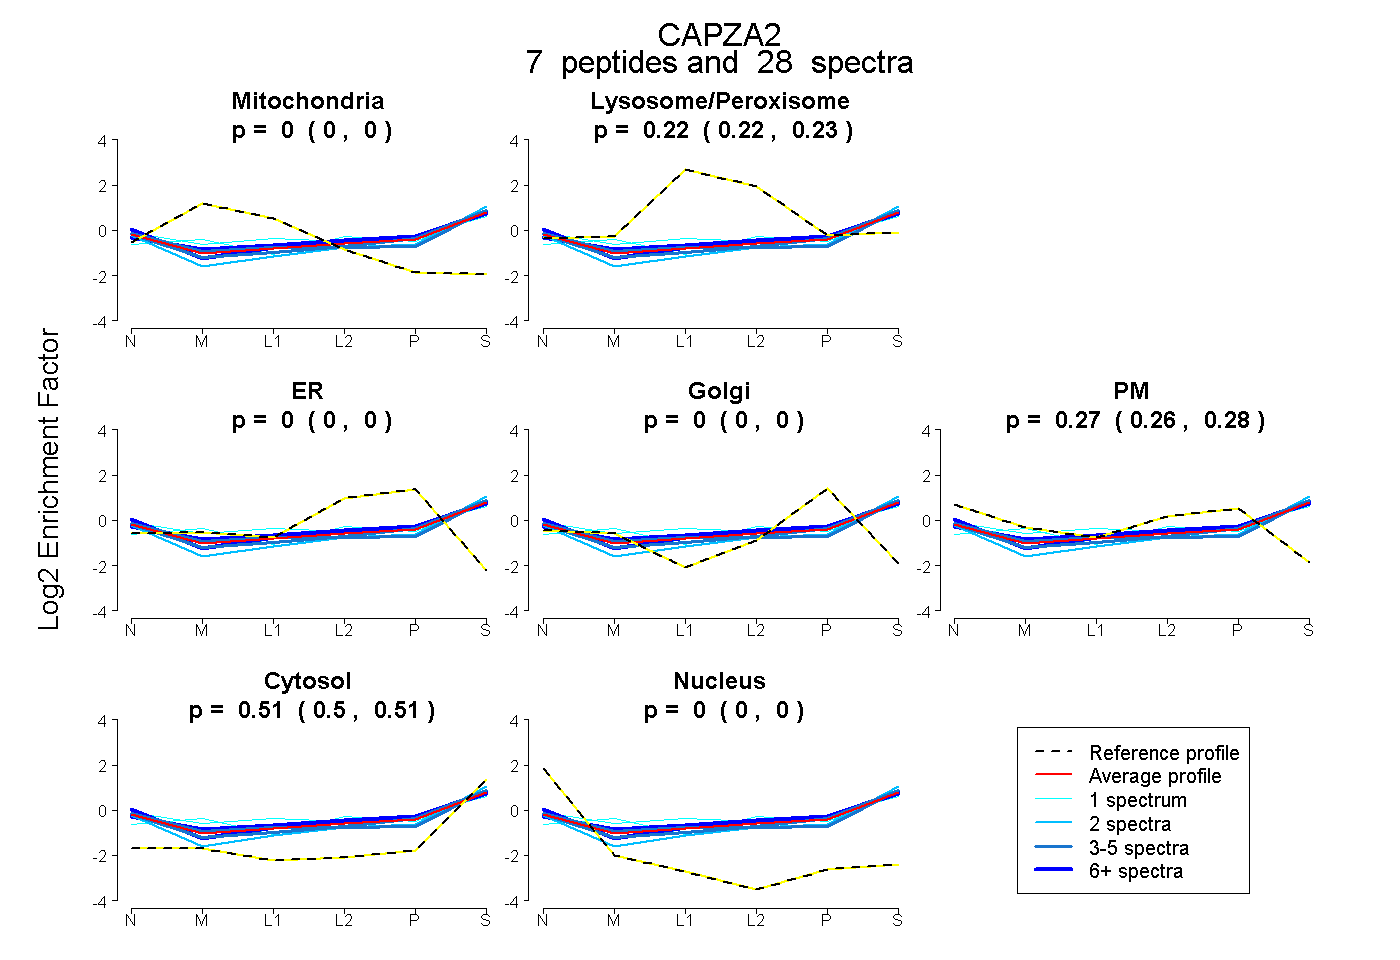
0.000 | 0.000
0.216 | 0.227
0.000 | 0.000
0.000 | 0.000
0.265 | 0.277
0.502 | 0.510
0.000 | 0.000