 4
4peptides
spectra
0.000 | 0.000
0.000 | 0.013
0.000 | 0.000
0.000 | 0.000
0.000 | 0.000
0.237 | 0.289
0.703 | 0.758
0.000 | 0.000
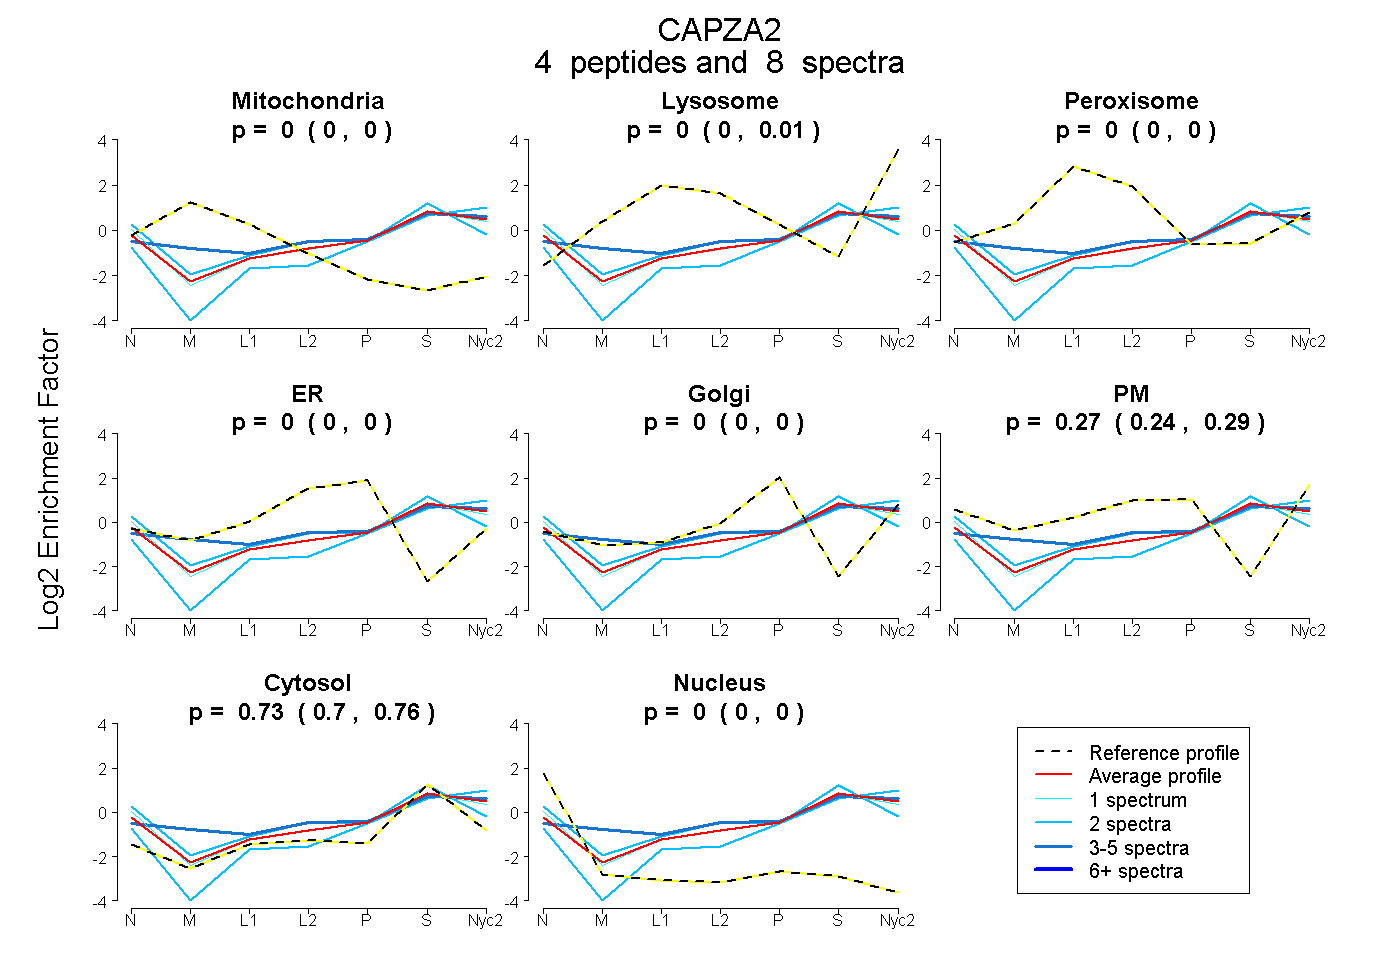
| Plot | Mito | Lyso | Perox | ER | Golgi | PM | Cytosol | Nucleus | |||||
| Expt A |
4 peptides |
8 spectra |
|
0.000 0.000 | 0.000 |
0.000 0.000 | 0.013 |
0.000 0.000 | 0.000 |
0.000 0.000 | 0.000 |
0.000 0.000 | 0.000 |
0.267 0.237 | 0.289 |
0.733 0.703 | 0.758 |
0.000 0.000 | 0.000 |
| 1 spectrum, TSVETALR | 0.000 | 0.000 | 0.000 | 0.000 | 0.000 | 0.265 | 0.735 | 0.000 | ||
| 2 spectra, EATDPRPYEAENAIESWR | 0.000 | 0.000 | 0.000 | 0.000 | 0.000 | 0.379 | 0.621 | 0.000 | ||
| 2 spectra, DIQDSLTVSNEVQTAK | 0.000 | 0.000 | 0.000 | 0.000 | 0.070 | 0.000 | 0.922 | 0.008 | ||
| 3 spectra, FIIHAPPGEFNEVFNDVR | 0.000 | 0.139 | 0.000 | 0.000 | 0.000 | 0.241 | 0.619 | 0.000 |
| Plot | Mito | Lyso or Perox | ER | Golgi | PM | Cytosol | Nucleus | ||||||
| Expt B |
7 peptides |
28 spectra |
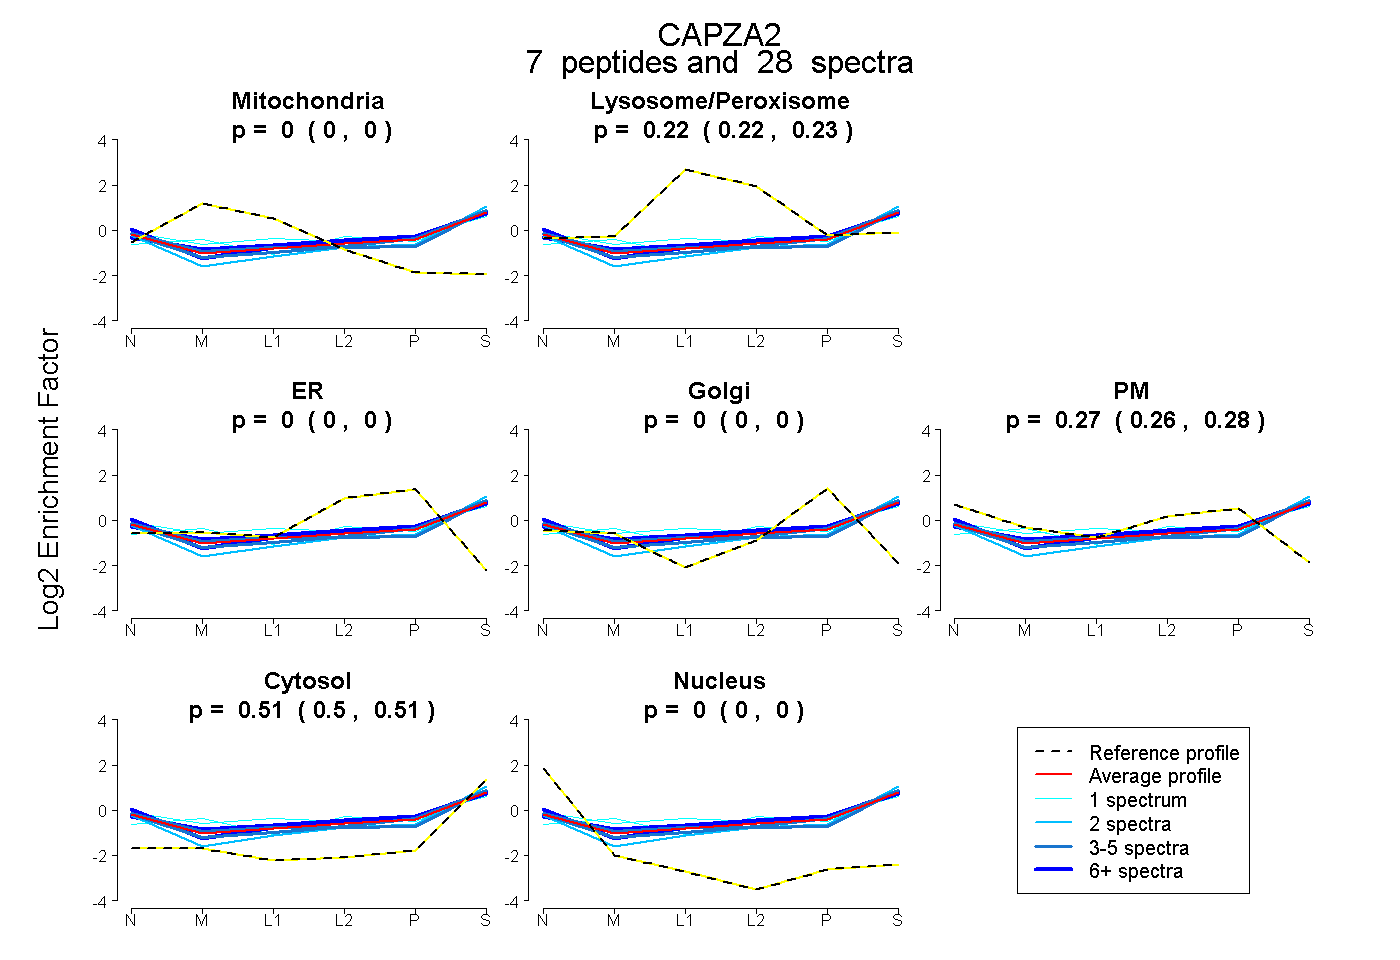 |
0.000 0.000 | 0.000 |
0.222 0.216 | 0.227 |
0.000 0.000 | 0.000 |
0.000 0.000 | 0.000 |
0.272 0.265 | 0.277 |
0.507 0.502 | 0.510 |
0.000 0.000 | 0.000 |
|||
| Plot | Lyso | Other | |||||||||||
| Expt C |
7 peptides |
29 spectra |
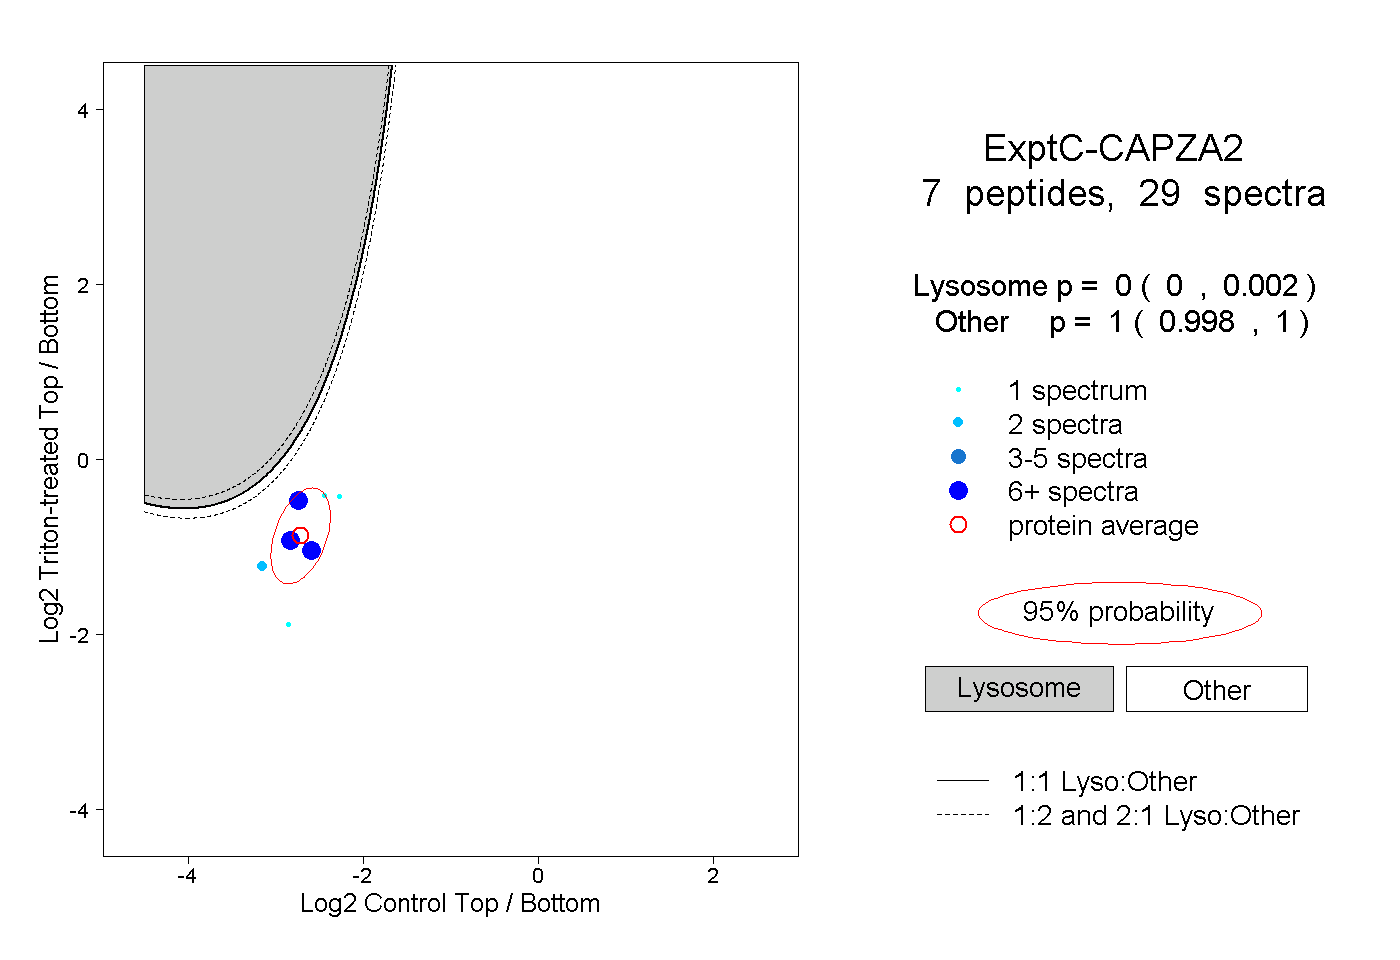 |
0.000 0.000 | 0.002 |
1.000 0.998 | 1.000 |
||||||||
| Plot | Lyso | Other | |||||||||||
| Expt D |
5 peptides |
14 spectra |
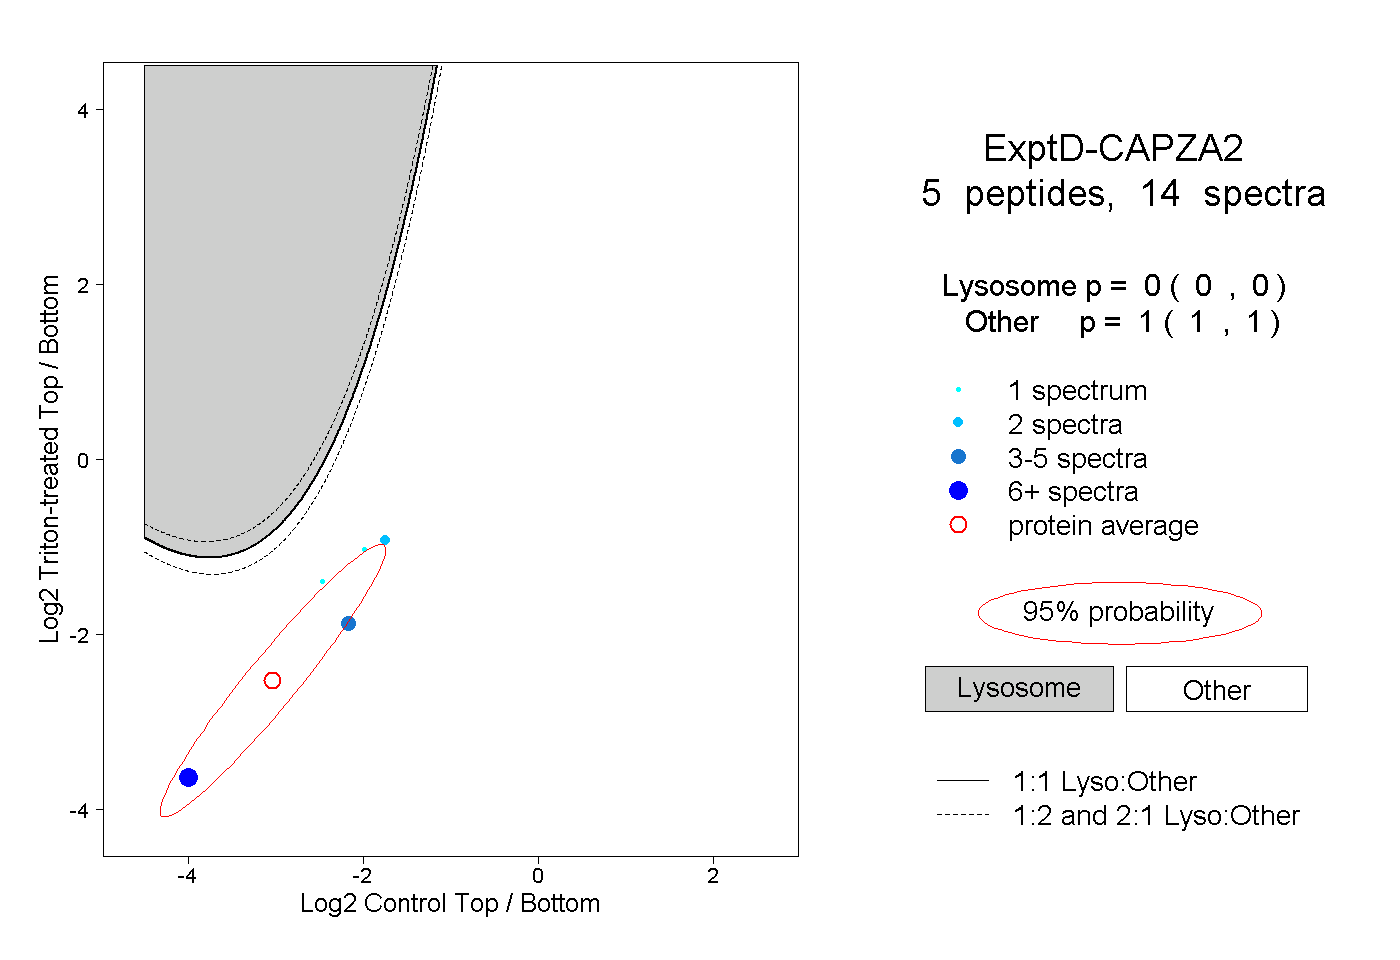 |
0.000 0.000 | 0.000 |
1.000 1.000 | 1.000 |