 7
7peptides
spectra
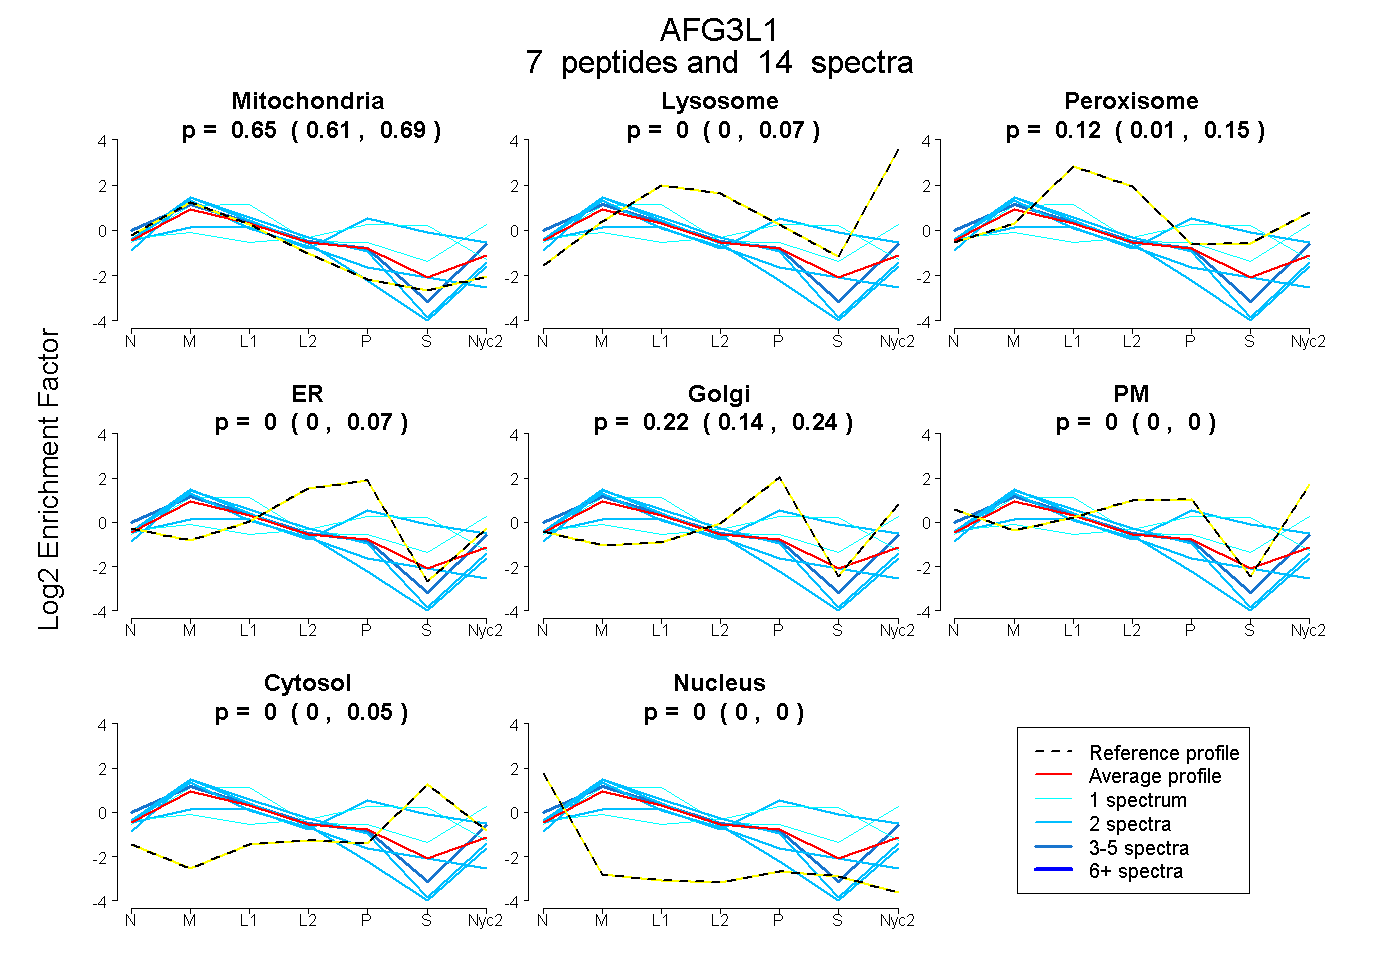
0.605 | 0.689
0.000 | 0.068
0.011 | 0.149
0.000 | 0.068
0.135 | 0.239
0.000 | 0.000
0.000 | 0.047
0.000 | 0.000
| Plot | Mito | Lyso | Perox | ER | Golgi | PM | Cytosol | Nucleus | |||||
| Expt A |
7 peptides |
14 spectra |
|
0.647 0.605 | 0.689 |
0.004 0.000 | 0.068 |
0.124 0.011 | 0.149 |
0.000 0.000 | 0.068 |
0.221 0.135 | 0.239 |
0.000 0.000 | 0.000 |
0.004 0.000 | 0.047 |
0.000 0.000 | 0.000 |
| 2 spectra, LGQVSFDFPR | 0.951 | 0.000 | 0.000 | 0.000 | 0.000 | 0.049 | 0.000 | 0.000 | ||
| 1 spectrum, HFVQYYLAR | 0.199 | 0.000 | 0.071 | 0.290 | 0.000 | 0.000 | 0.440 | 0.000 | ||
| 2 spectra, GLGYAQYLPR | 0.188 | 0.000 | 0.211 | 0.000 | 0.310 | 0.000 | 0.292 | 0.000 | ||
| 2 spectra, MCMMLGGR | 0.750 | 0.034 | 0.000 | 0.215 | 0.000 | 0.000 | 0.000 | 0.000 | ||
| 2 spectra, TLELLTQCR | 0.906 | 0.000 | 0.000 | 0.051 | 0.000 | 0.000 | 0.044 | 0.000 | ||
| 4 spectra, GDDFTWWK | 0.652 | 0.000 | 0.000 | 0.000 | 0.000 | 0.348 | 0.000 | 0.000 | ||
| 1 spectrum, FADVAGCEEAK | 0.502 | 0.332 | 0.075 | 0.000 | 0.057 | 0.000 | 0.035 | 0.000 |
| Plot | Mito | Lyso or Perox | ER | Golgi | PM | Cytosol | Nucleus | ||||||
| Expt B |
2 peptides |
2 spectra |
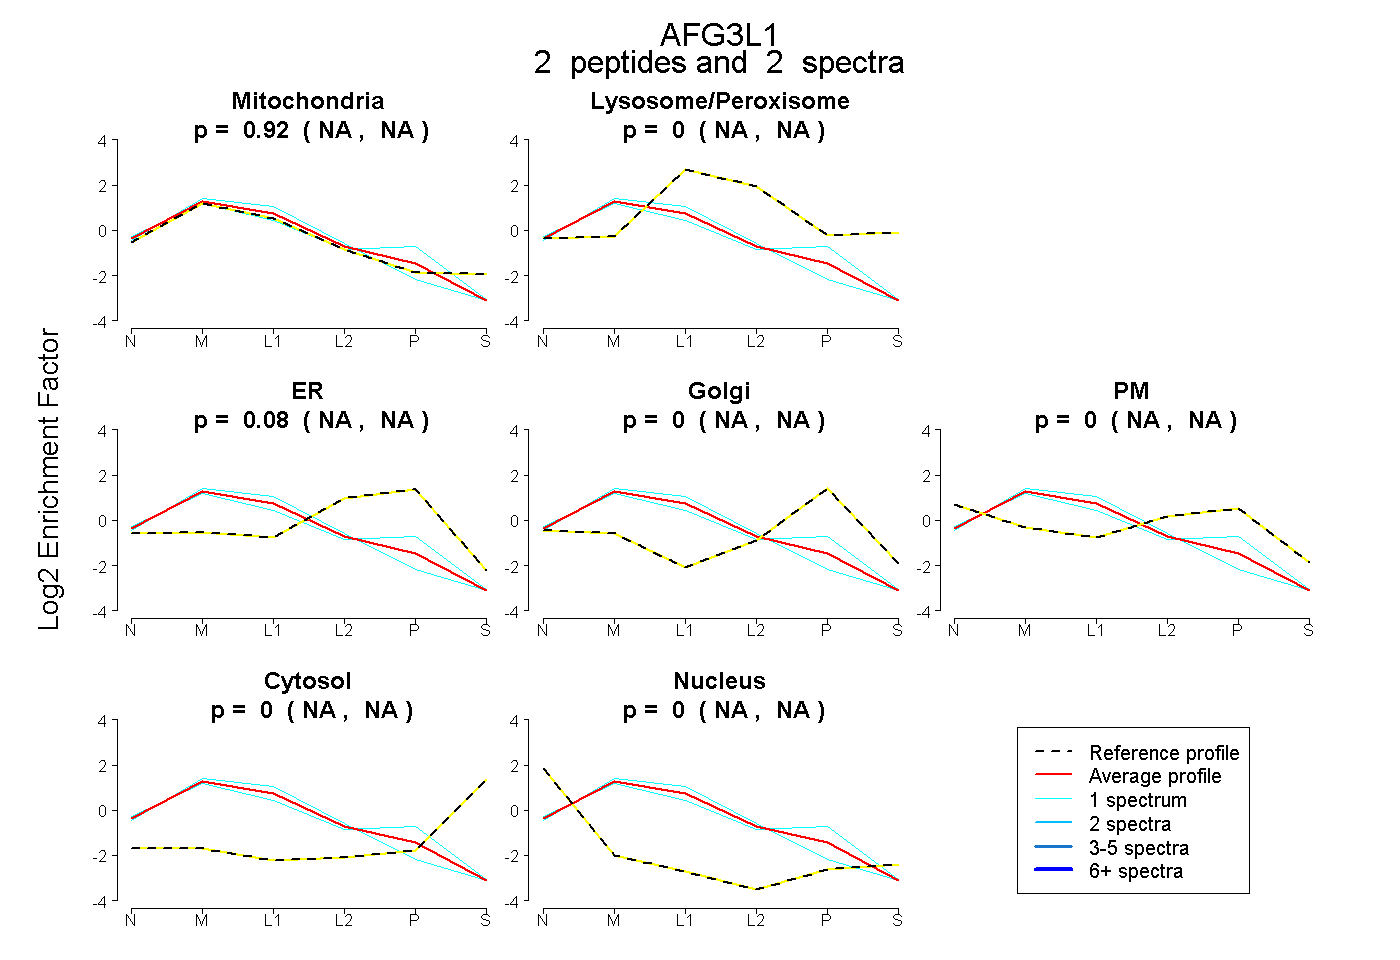 |
0.923 NA | NA |
0.000 NA | NA |
0.077 NA | NA |
0.000 NA | NA |
0.000 NA | NA |
0.000 NA | NA |
0.000 NA | NA |
|||
| Plot | Lyso | Other | |||||||||||
| Expt C |
18 peptides |
69 spectra |
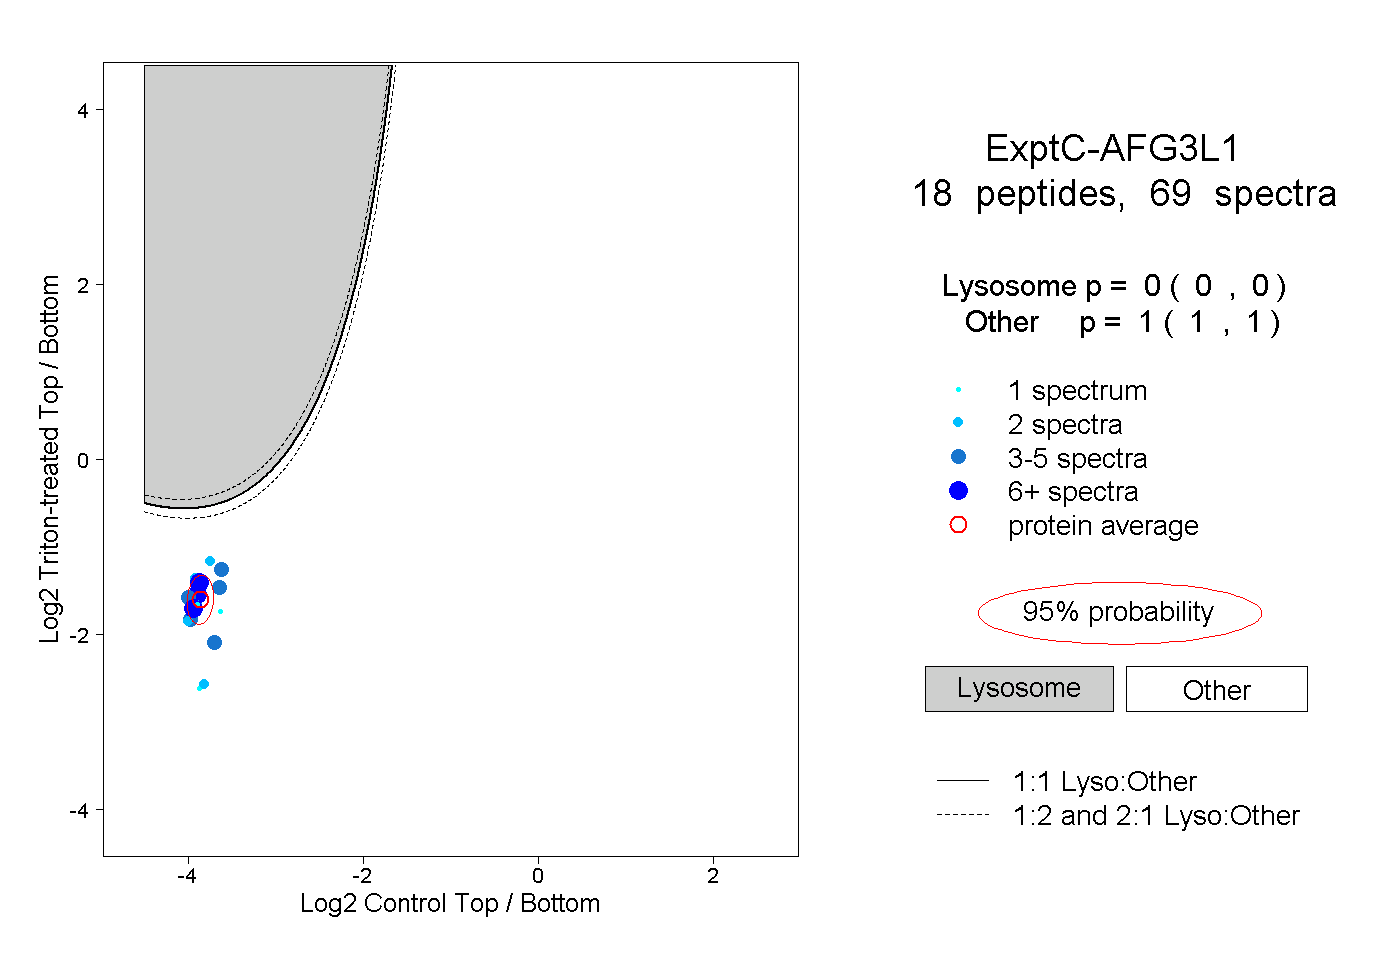 |
0.000 0.000 | 0.000 |
1.000 1.000 | 1.000 |
||||||||
| Plot | Lyso | Other | |||||||||||
| Expt D |
2 peptides |
2 spectra |
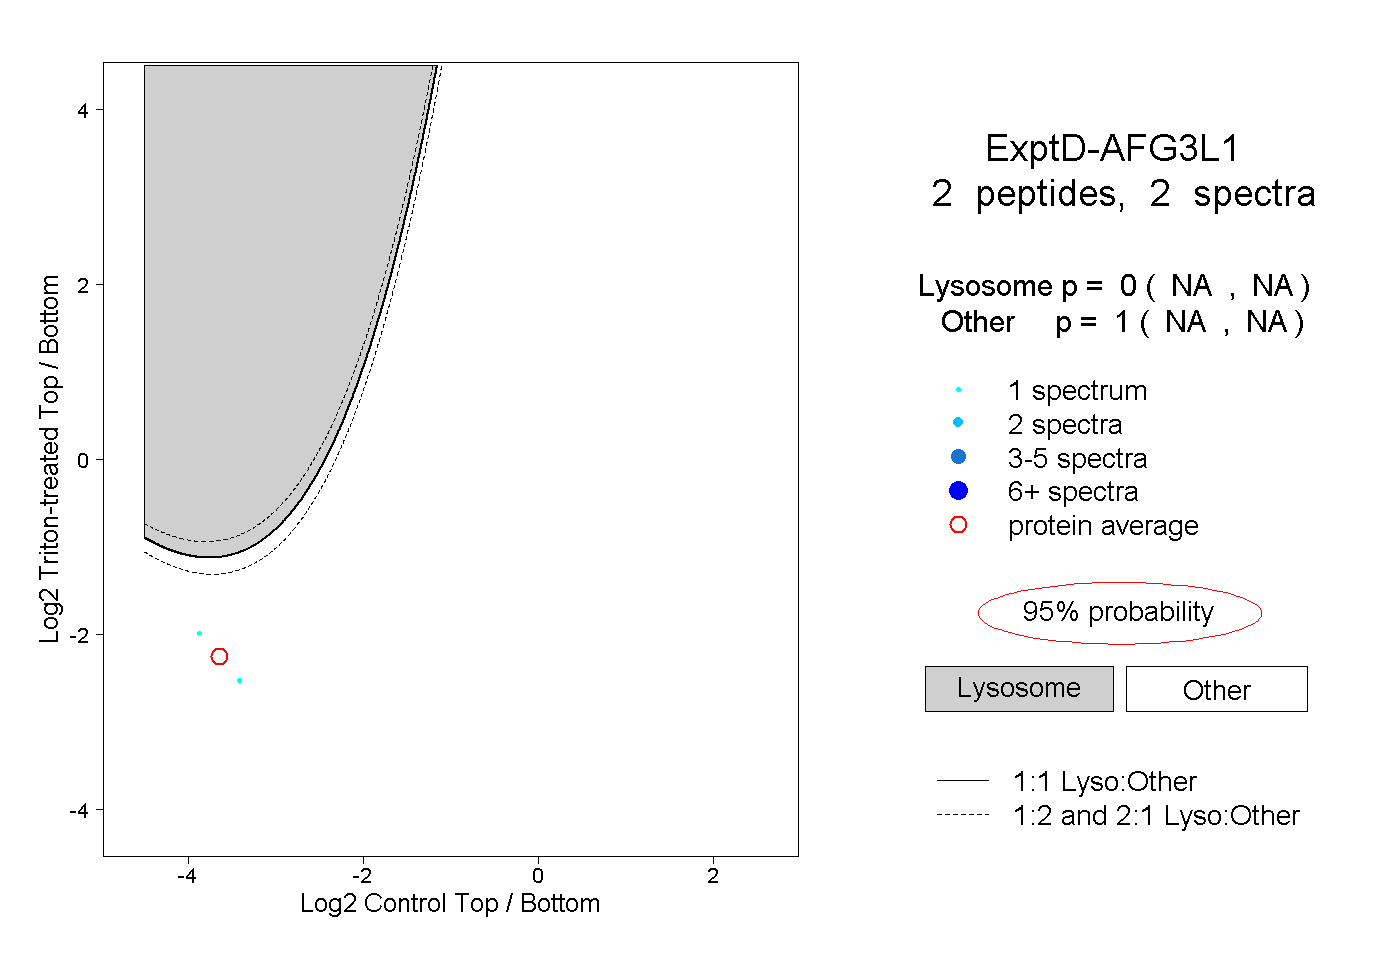 |
0.000 NA | NA |
1.000 NA | NA |