 3
3peptides
spectra
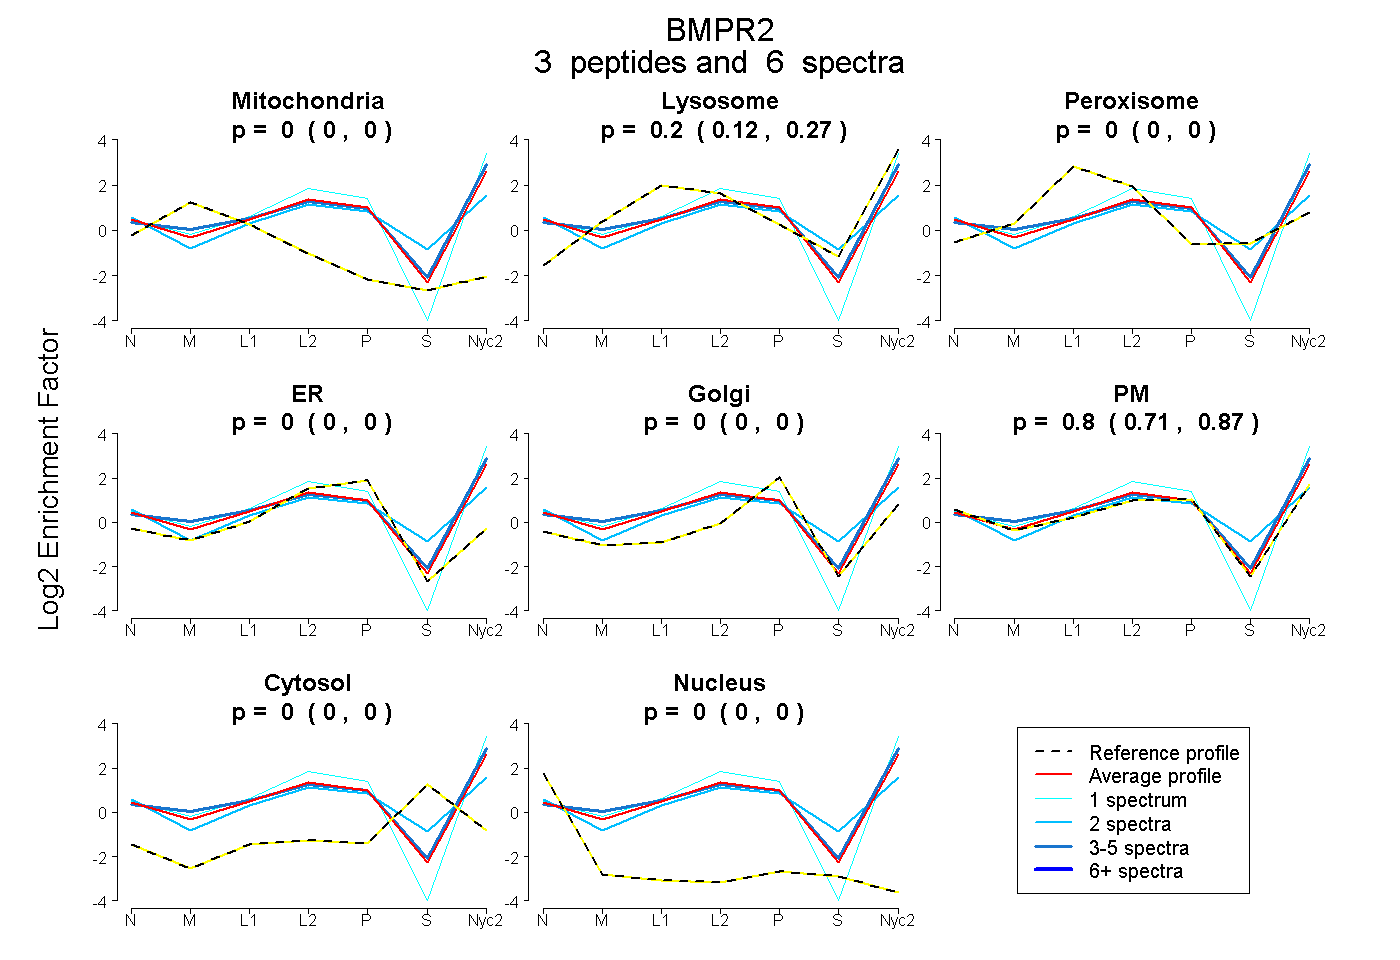
0.000 | 0.000
0.118 | 0.274
0.000 | 0.000
0.000 | 0.000
0.000 | 0.000
0.708 | 0.868
0.000 | 0.000
0.000 | 0.000
| Plot | Mito | Lyso | Perox | ER | Golgi | PM | Cytosol | Nucleus | |||||
| Expt A |
3 peptides |
6 spectra |
|
0.000 0.000 | 0.000 |
0.204 0.118 | 0.274 |
0.000 0.000 | 0.000 |
0.000 0.000 | 0.000 |
0.000 0.000 | 0.000 |
0.796 0.708 | 0.868 |
0.000 0.000 | 0.000 |
0.000 0.000 | 0.000 |
| 1 spectrum, LLELIGR | 0.000 | 0.173 | 0.000 | 0.000 | 0.000 | 0.827 | 0.000 | 0.000 | ||
| 3 spectra, VFSFANR | 0.000 | 0.301 | 0.000 | 0.000 | 0.000 | 0.699 | 0.000 | 0.000 | ||
| 2 spectra, LTAQCAEER | 0.000 | 0.044 | 0.120 | 0.000 | 0.000 | 0.688 | 0.147 | 0.000 |
| Plot | Lyso | Other | |||||||||||
| Expt C |
4 peptides |
6 spectra |
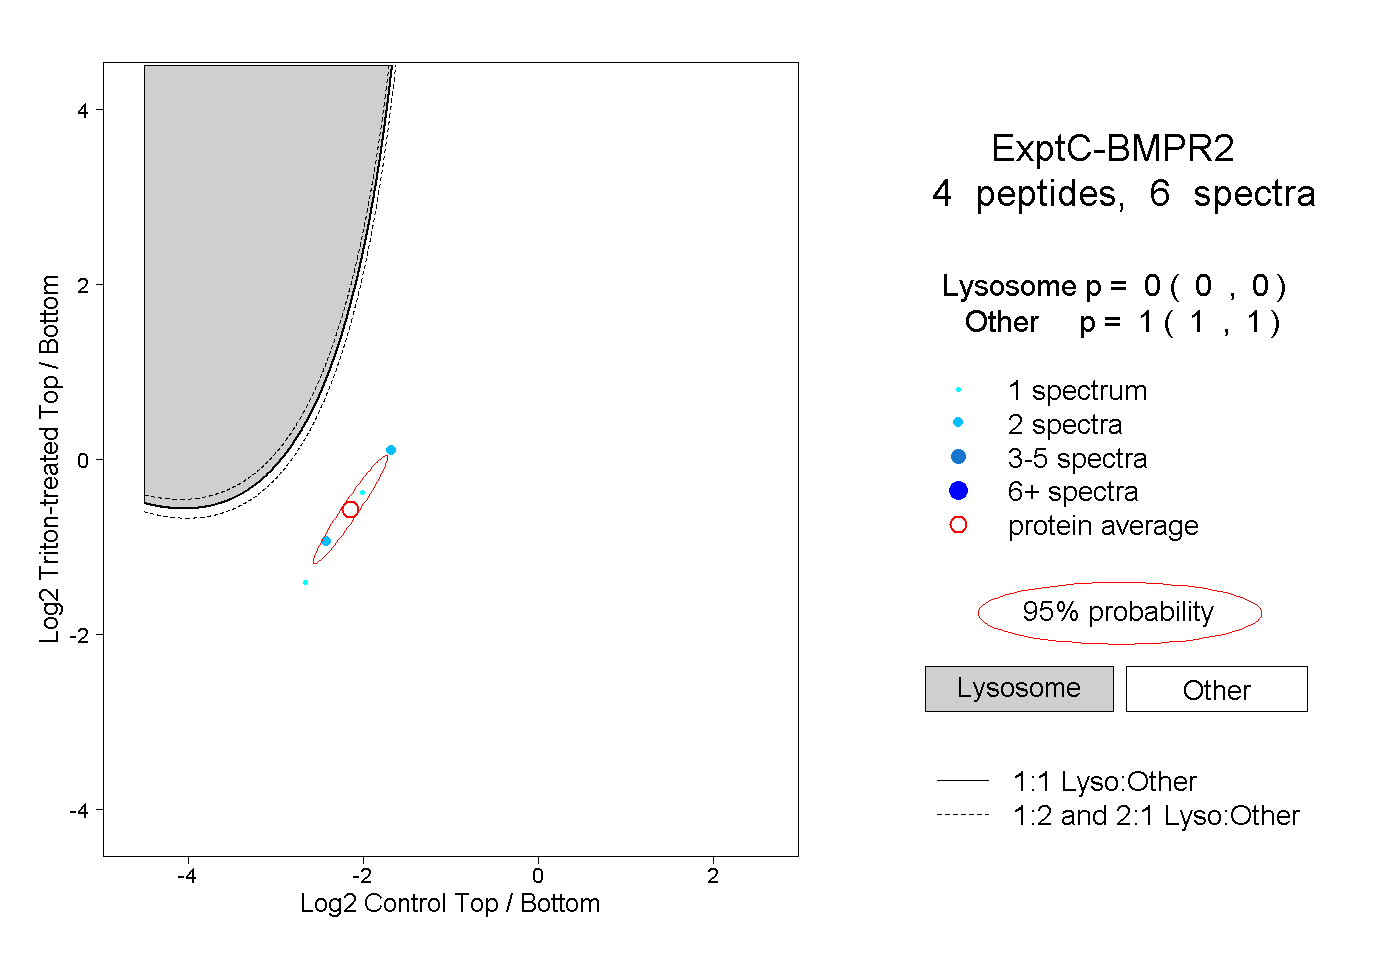 |
0.000 0.000 | 0.000 |
1.000 1.000 | 1.000 |