 6
6peptides
spectra
0.000 | 0.000
0.000 | 0.000
0.000 | 0.000
0.679 | 0.700
0.000 | 0.005
0.000 | 0.000
0.278 | 0.310
0.000 | 0.023
| Plot | Mito | Lyso | Perox | ER | Golgi | PM | Cytosol | Nucleus | |||||
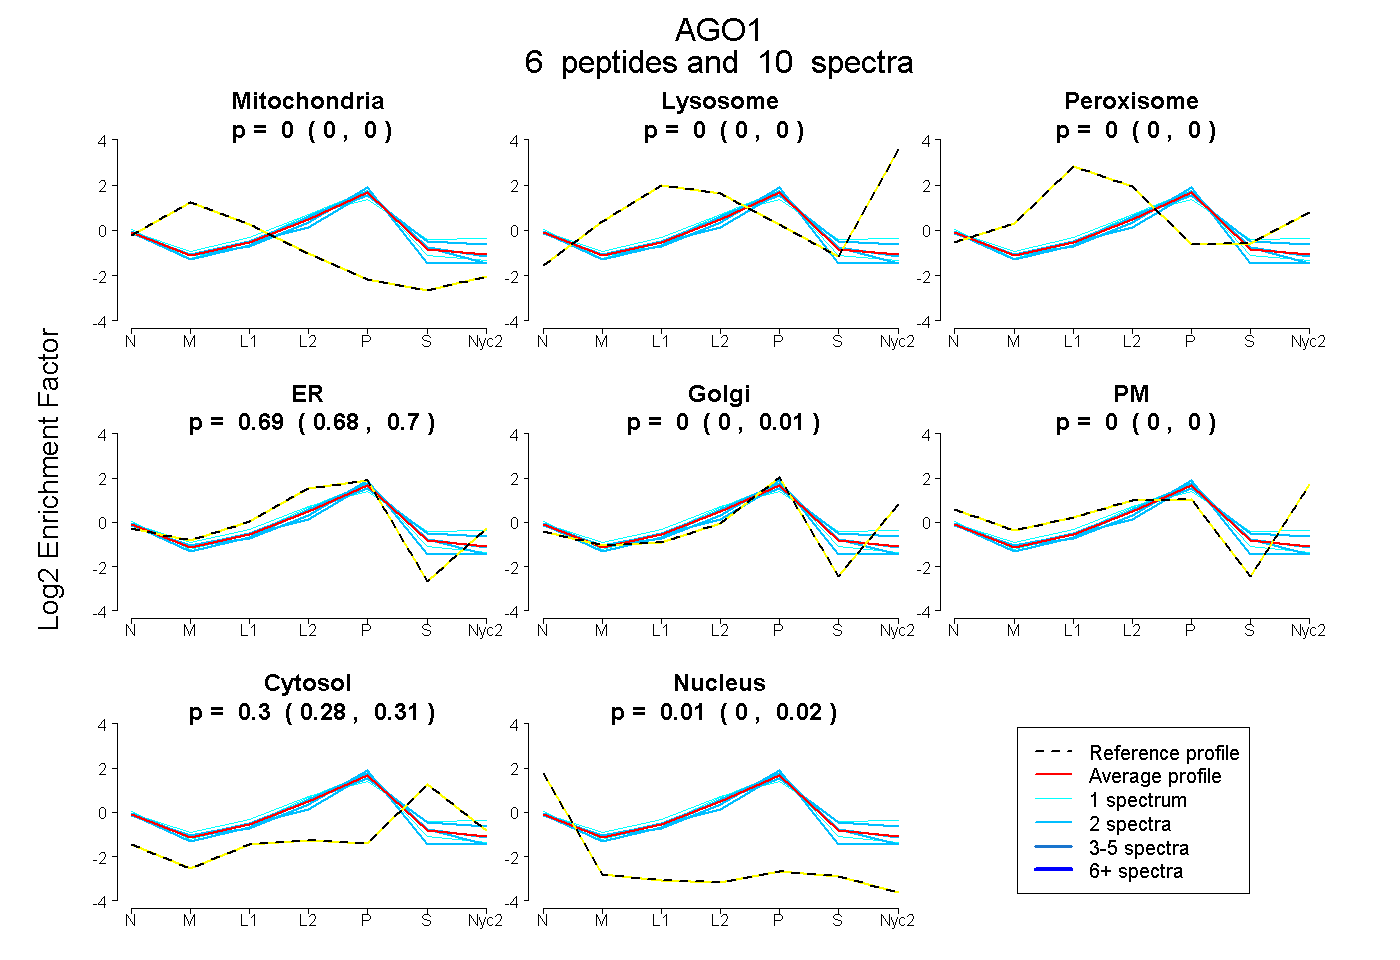
| Expt A |
6 peptides |
10 spectra |
|
0.000 0.000 | 0.000 |
0.000 0.000 | 0.000 |
0.000 0.000 | 0.000 |
0.692 0.679 | 0.700 |
0.000 0.000 | 0.005 |
0.000 0.000 | 0.000 |
0.296 0.278 | 0.310 |
0.012 0.000 | 0.023 |
| 2 spectra, NIYTVTALPIGNER | 0.000 | 0.000 | 0.000 | 0.645 | 0.020 | 0.000 | 0.335 | 0.000 | ||
| 2 spectra, VLPAPILQYGGR | 0.000 | 0.000 | 0.000 | 0.729 | 0.006 | 0.000 | 0.164 | 0.102 | ||
| 2 spectra, QEIIEDLSYMVR | 0.000 | 0.000 | 0.000 | 0.686 | 0.000 | 0.000 | 0.305 | 0.009 | ||
| 1 spectrum, NFTDQLR | 0.000 | 0.000 | 0.087 | 0.534 | 0.075 | 0.010 | 0.295 | 0.000 | ||
| 2 spectra, SVSIPAPAYYAR | 0.000 | 0.000 | 0.000 | 0.654 | 0.000 | 0.000 | 0.298 | 0.048 | ||
| 1 spectrum, AIATPNQGVWDMR | 0.000 | 0.000 | 0.000 | 0.728 | 0.000 | 0.000 | 0.225 | 0.047 |
| Plot | Mito | Lyso or Perox | ER | Golgi | PM | Cytosol | Nucleus | ||||||
| Expt B |
1 peptide |
1 spectrum |
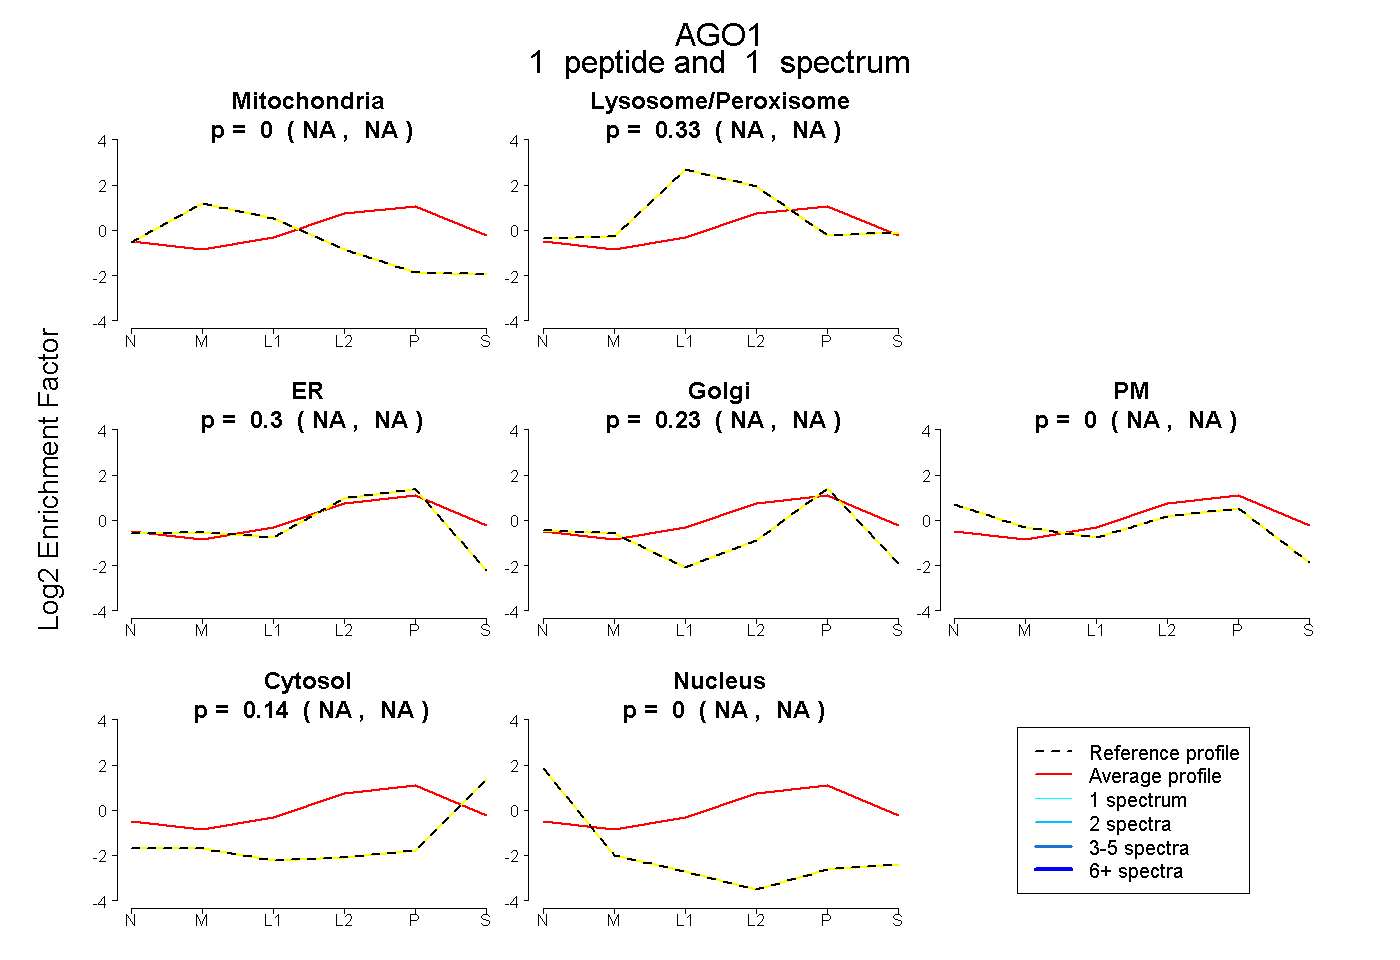 |
0.000 NA | NA |
0.333 NA | NA |
0.303 NA | NA |
0.226 NA | NA |
0.000 NA | NA |
0.138 NA | NA |
0.000 NA | NA |
|||
| Plot | Lyso | Other | |||||||||||
| Expt C |
4 peptides |
7 spectra |
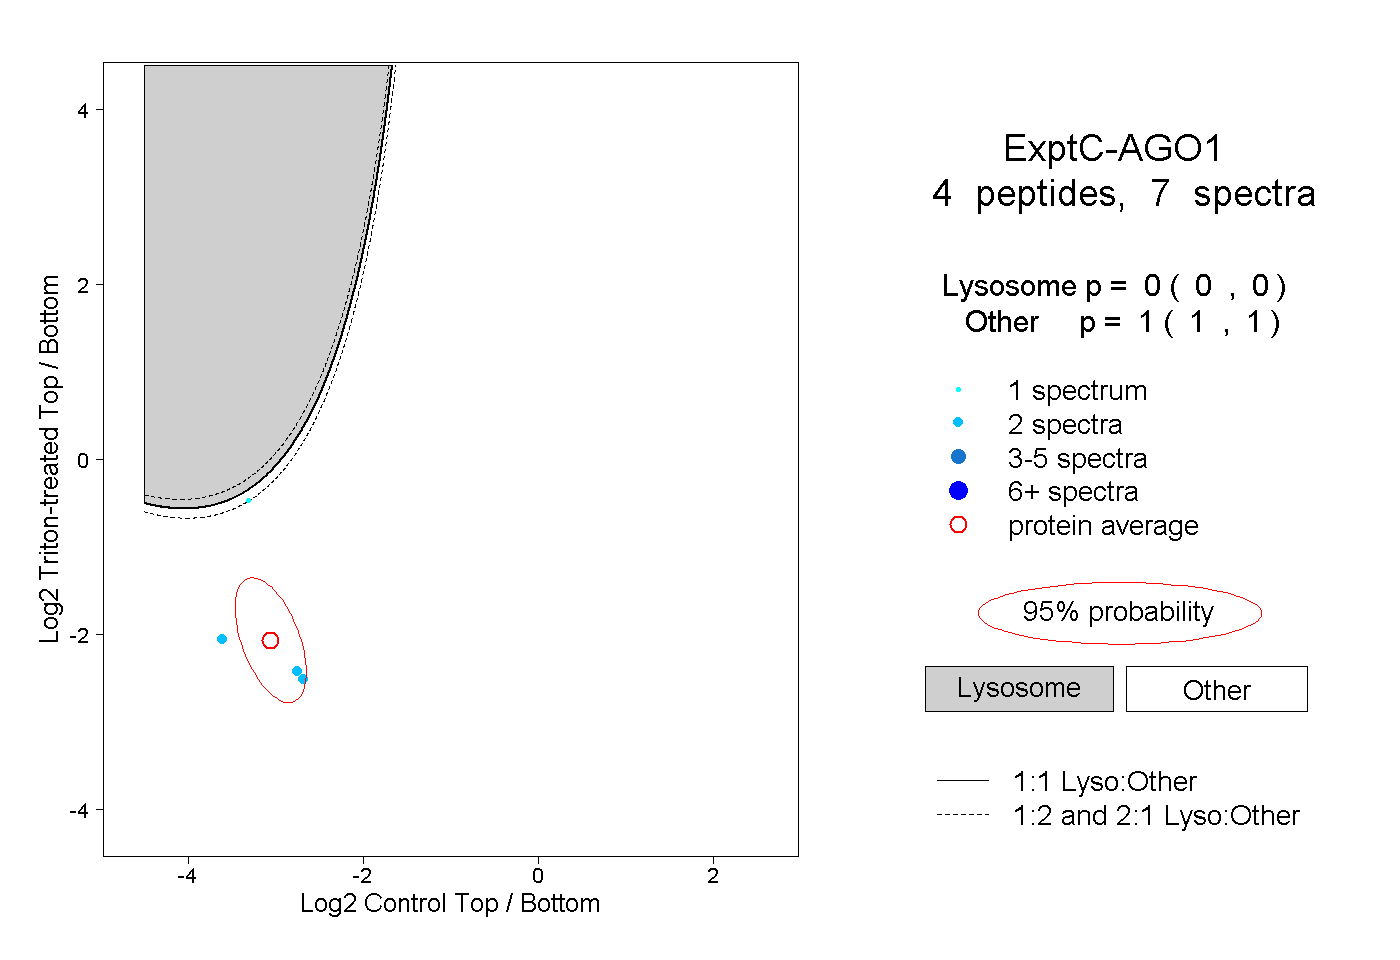 |
0.000 0.000 | 0.000 |
1.000 1.000 | 1.000 |
||||||||
| Plot | Lyso | Other | |||||||||||
| Expt D |
1 peptide |
1 spectrum |
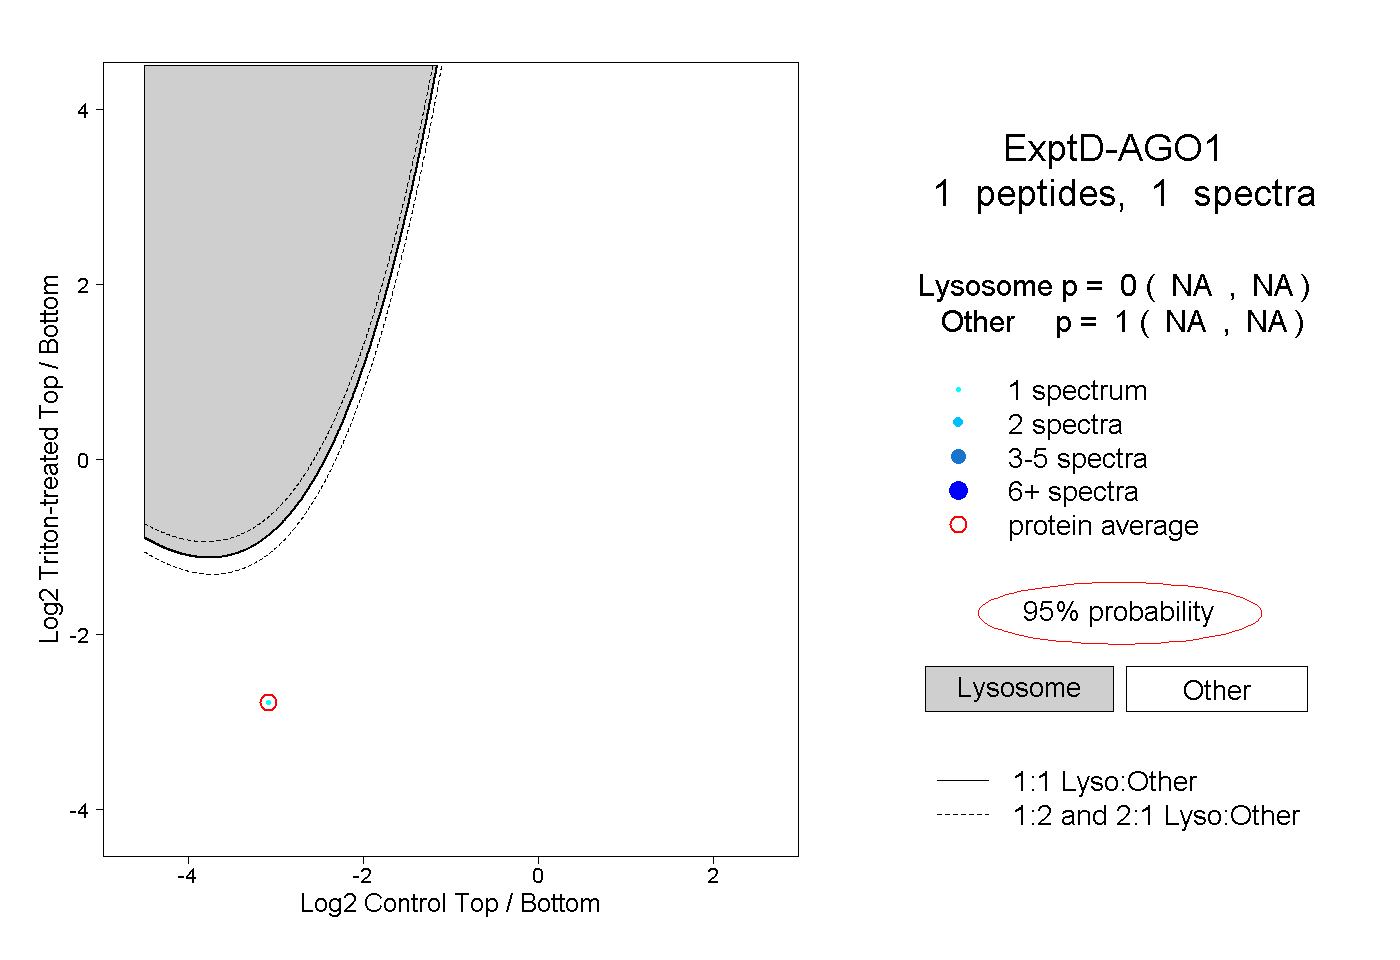 |
0.000 NA | NA |
1.000 NA | NA |