 4
4peptides
spectra
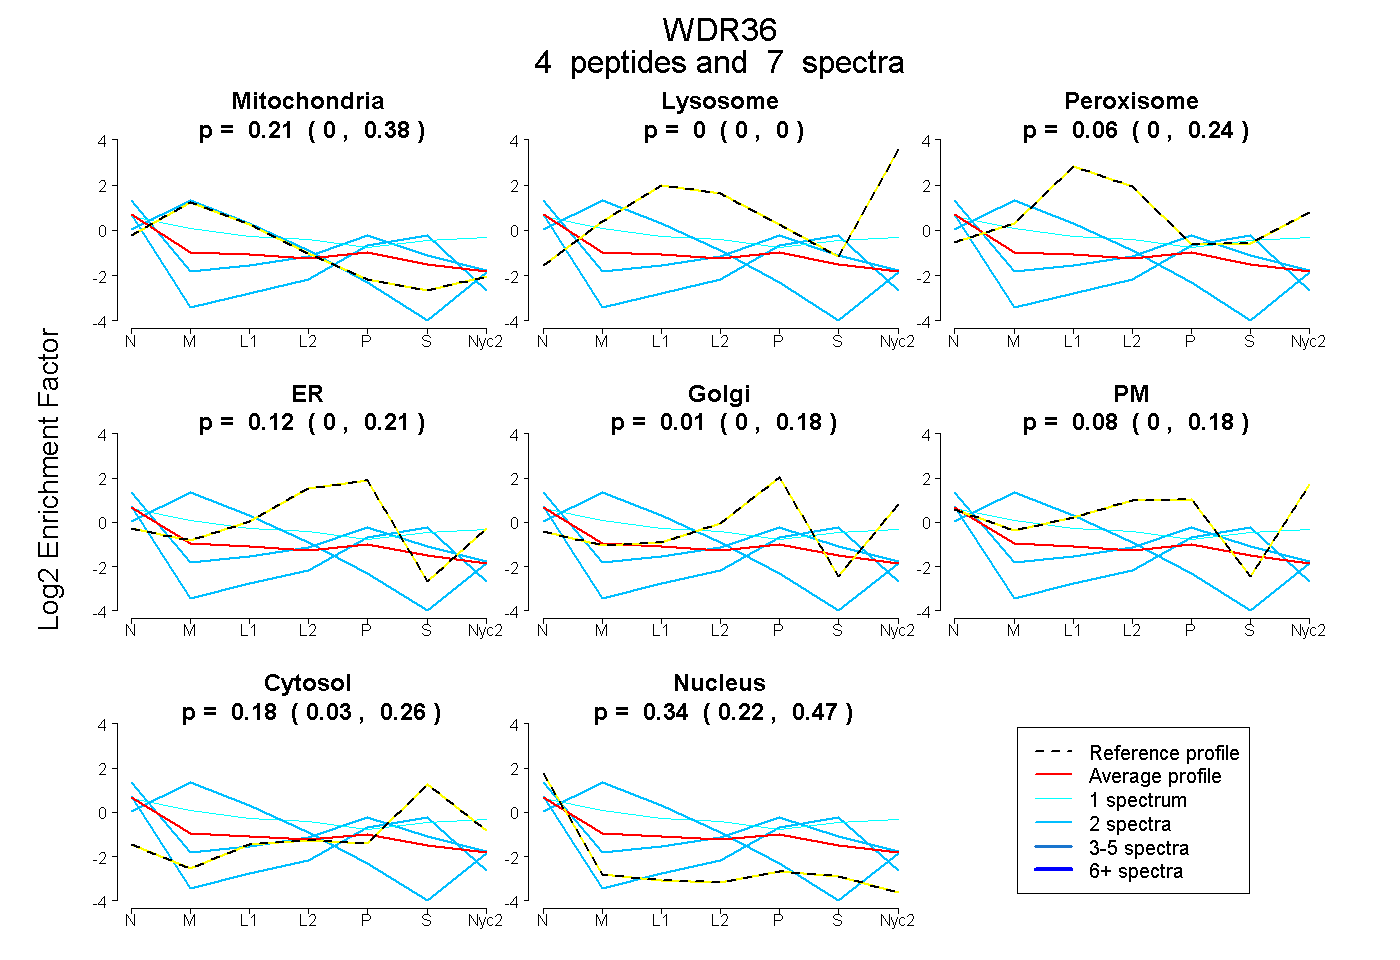
0.000 | 0.379
0.000 | 0.000
0.000 | 0.244
0.000 | 0.212
0.000 | 0.184
0.000 | 0.183
0.030 | 0.263
0.216 | 0.466
| Plot | Mito | Lyso | Perox | ER | Golgi | PM | Cytosol | Nucleus | |||||
| Expt A |
4 peptides |
7 spectra |
|
0.211 0.000 | 0.379 |
0.000 0.000 | 0.000 |
0.062 0.000 | 0.244 |
0.118 0.000 | 0.212 |
0.013 0.000 | 0.184 |
0.080 0.000 | 0.183 |
0.179 0.030 | 0.263 |
0.338 0.216 | 0.466 |
| 2 spectra, ELGPSGIETELR | 0.000 | 0.000 | 0.000 | 0.000 | 0.033 | 0.000 | 0.479 | 0.488 | ||
| 2 spectra, YNALK | 0.990 | 0.000 | 0.000 | 0.000 | 0.000 | 0.010 | 0.000 | 0.000 | ||
| 1 spectrum, MLPSEPVLLEELVK | 0.276 | 0.000 | 0.112 | 0.000 | 0.000 | 0.288 | 0.292 | 0.033 | ||
| 2 spectra, GSFGDEK | 0.000 | 0.000 | 0.000 | 0.224 | 0.000 | 0.144 | 0.226 | 0.406 |
| Plot | Lyso | Other | |||||||||||
| Expt C |
1 peptide |
59 spectra |
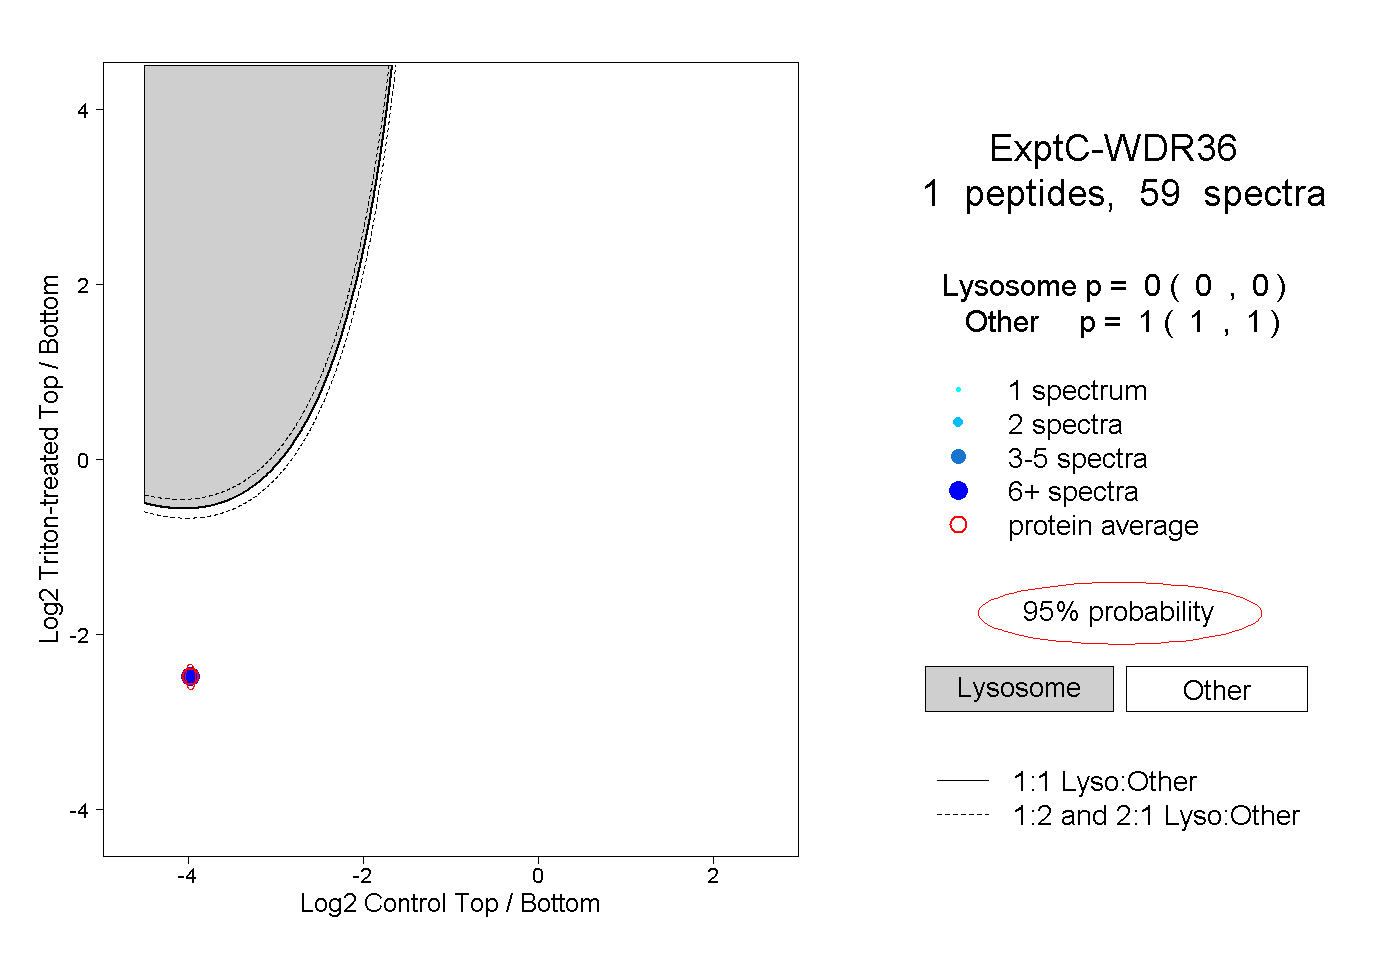 |
0.000 0.000 | 0.000 |
1.000 1.000 | 1.000 |