 5
5peptides
spectra
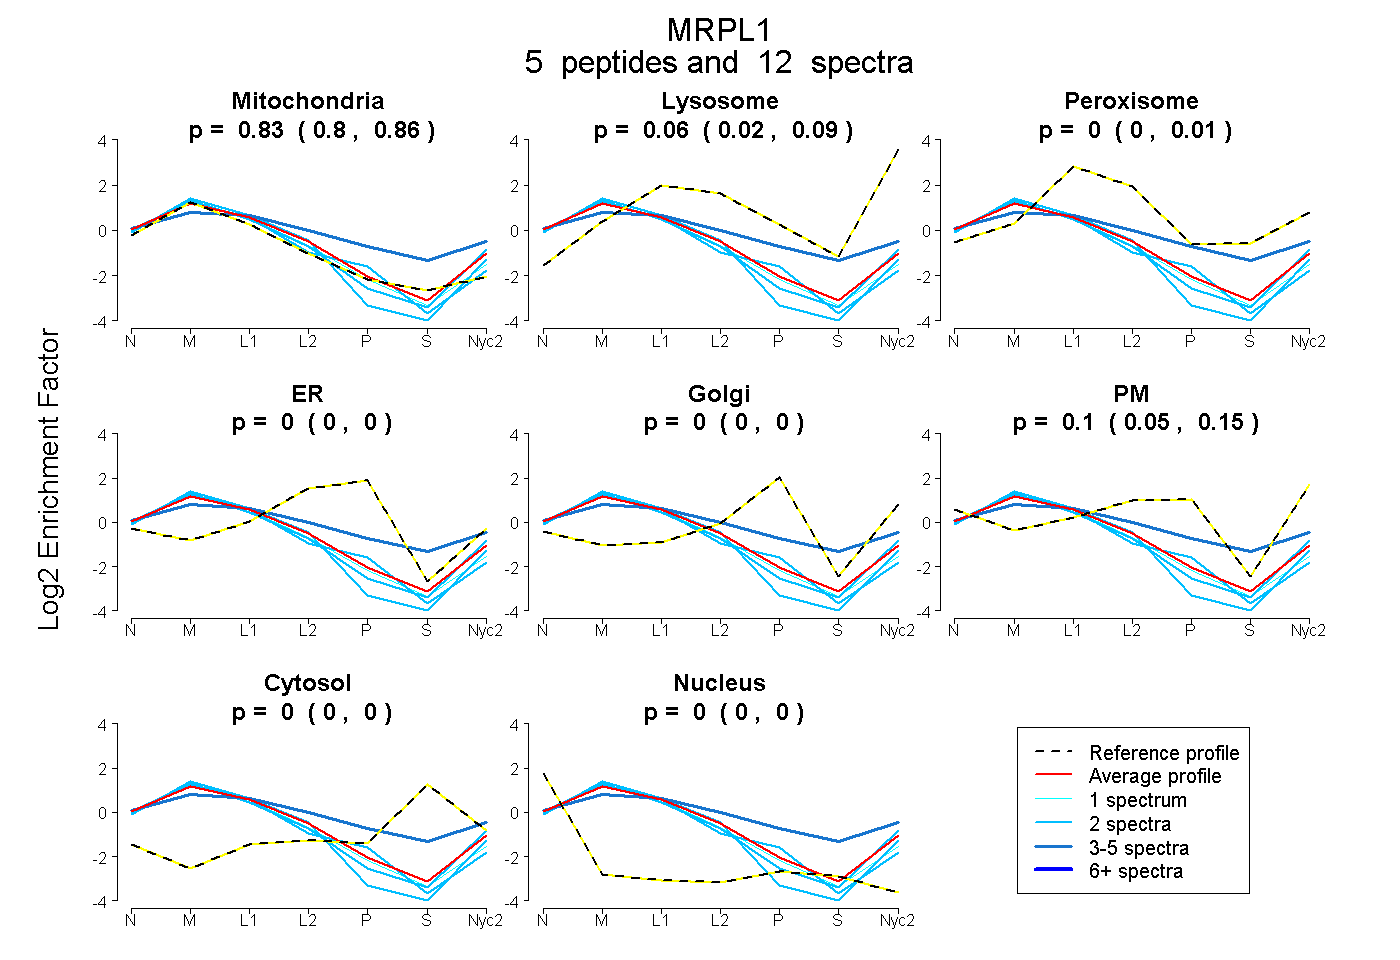
0.798 | 0.862
0.025 | 0.094
0.000 | 0.010
0.000 | 0.000
0.000 | 0.000
0.048 | 0.150
0.000 | 0.000
0.000 | 0.000
2peptides
spectra
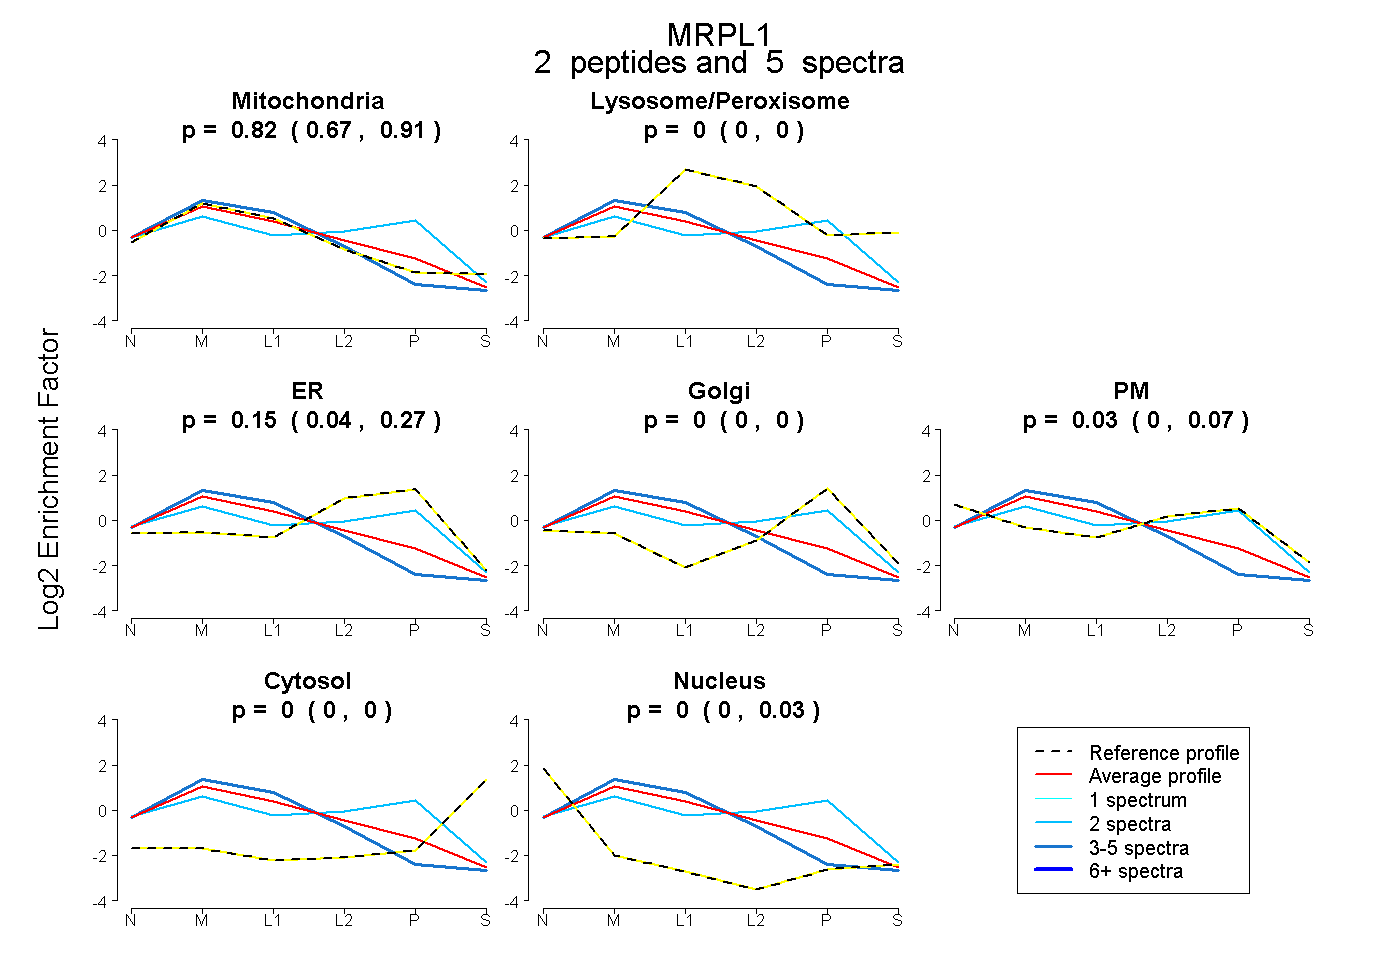
0.675 | 0.913
0.000 | 0.000
0.039 | 0.271
0.000 | 0.000
0.000 | 0.071
0.000 | 0.000
0.000 | 0.032
9peptides
spectra
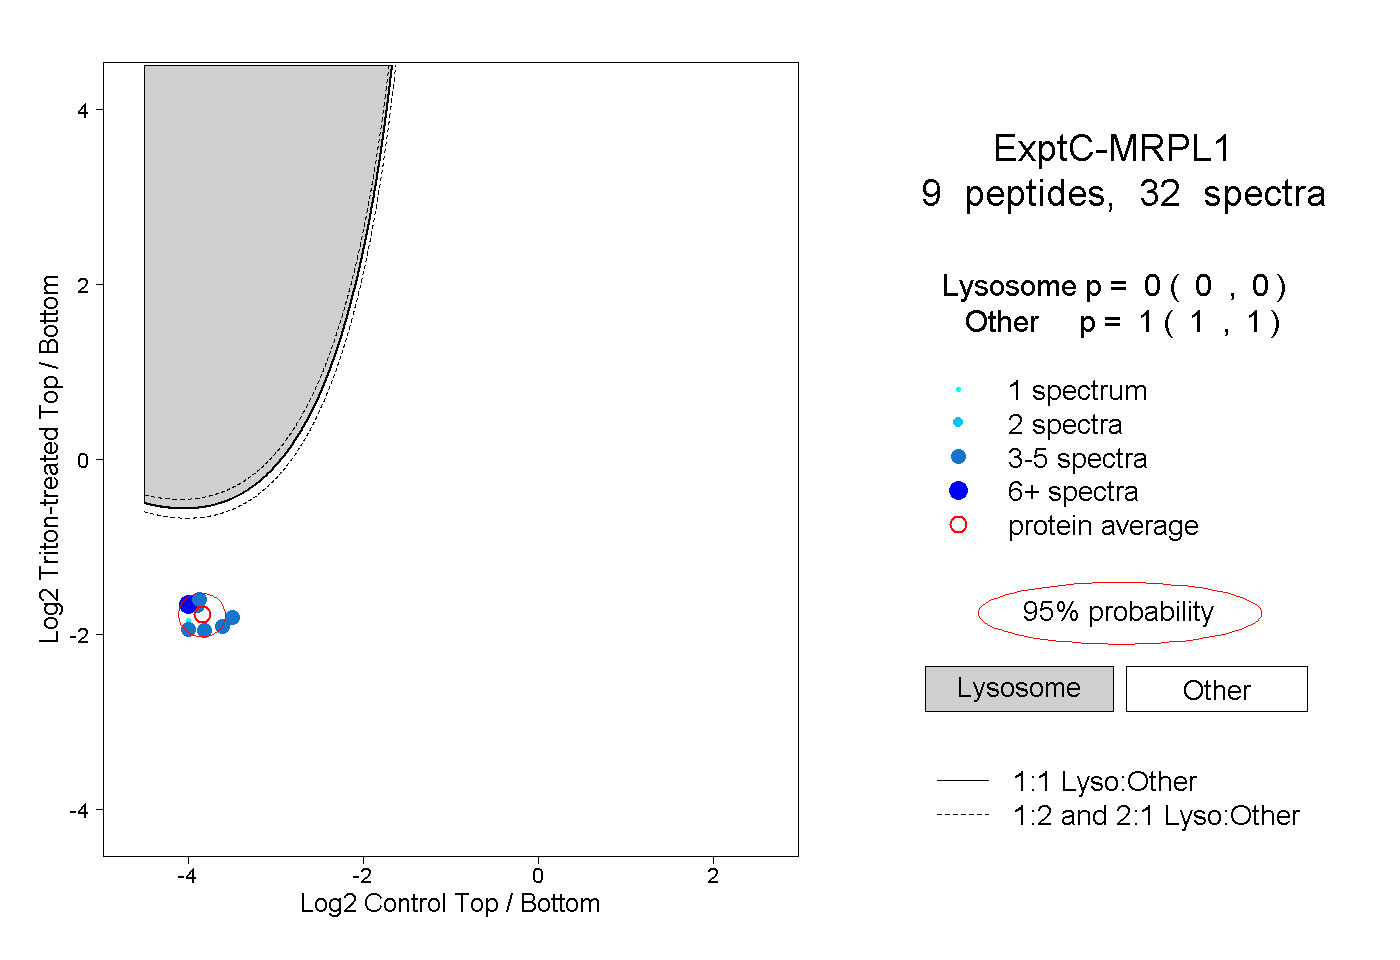
0.000 | 0.000
1.000 | 1.000
5peptides
spectra

0.000 | 0.000
1.000 | 1.000