 1
1peptide
spectrum
NA | NA
NA | NA
NA | NA
NA | NA
NA | NA
NA | NA
NA | NA
NA | NA
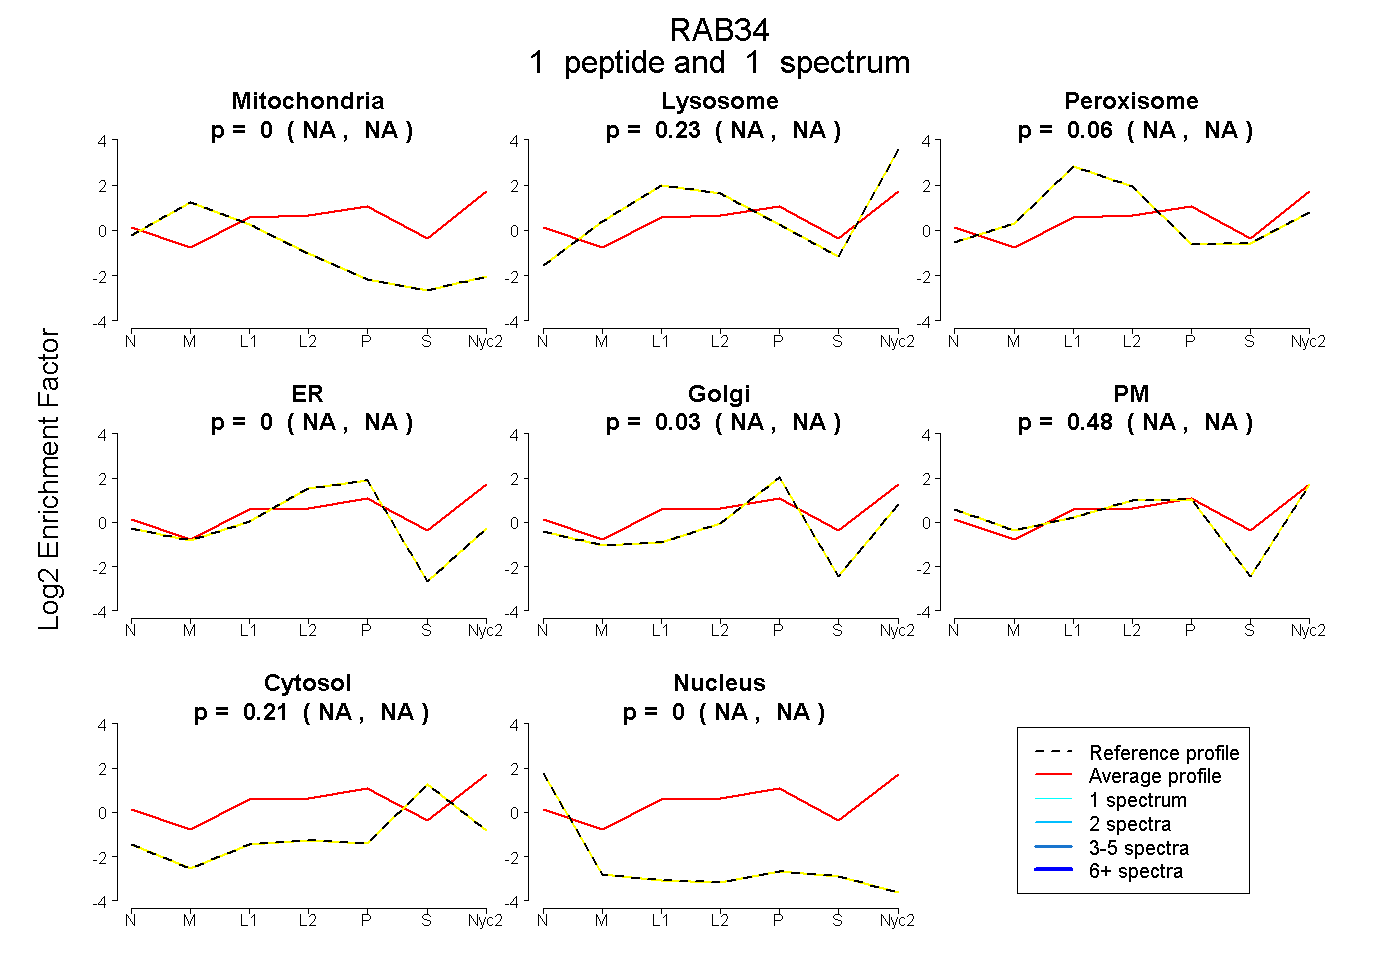
| Plot | Mito | Lyso | Perox | ER | Golgi | PM | Cytosol | Nucleus | |||||
| Expt A |
1 peptide |
1 spectrum |
|
0.000 NA | NA |
0.228 NA | NA |
0.059 NA | NA |
0.000 NA | NA |
0.026 NA | NA |
0.479 NA | NA |
0.208 NA | NA |
0.000 NA | NA |
| 1 spectrum, ATIGVDFEMER | 0.000 | 0.228 | 0.059 | 0.000 | 0.026 | 0.479 | 0.208 | 0.000 |
| Plot | Lyso | Other | |||||||||||
| Expt C |
6 peptides |
15 spectra |
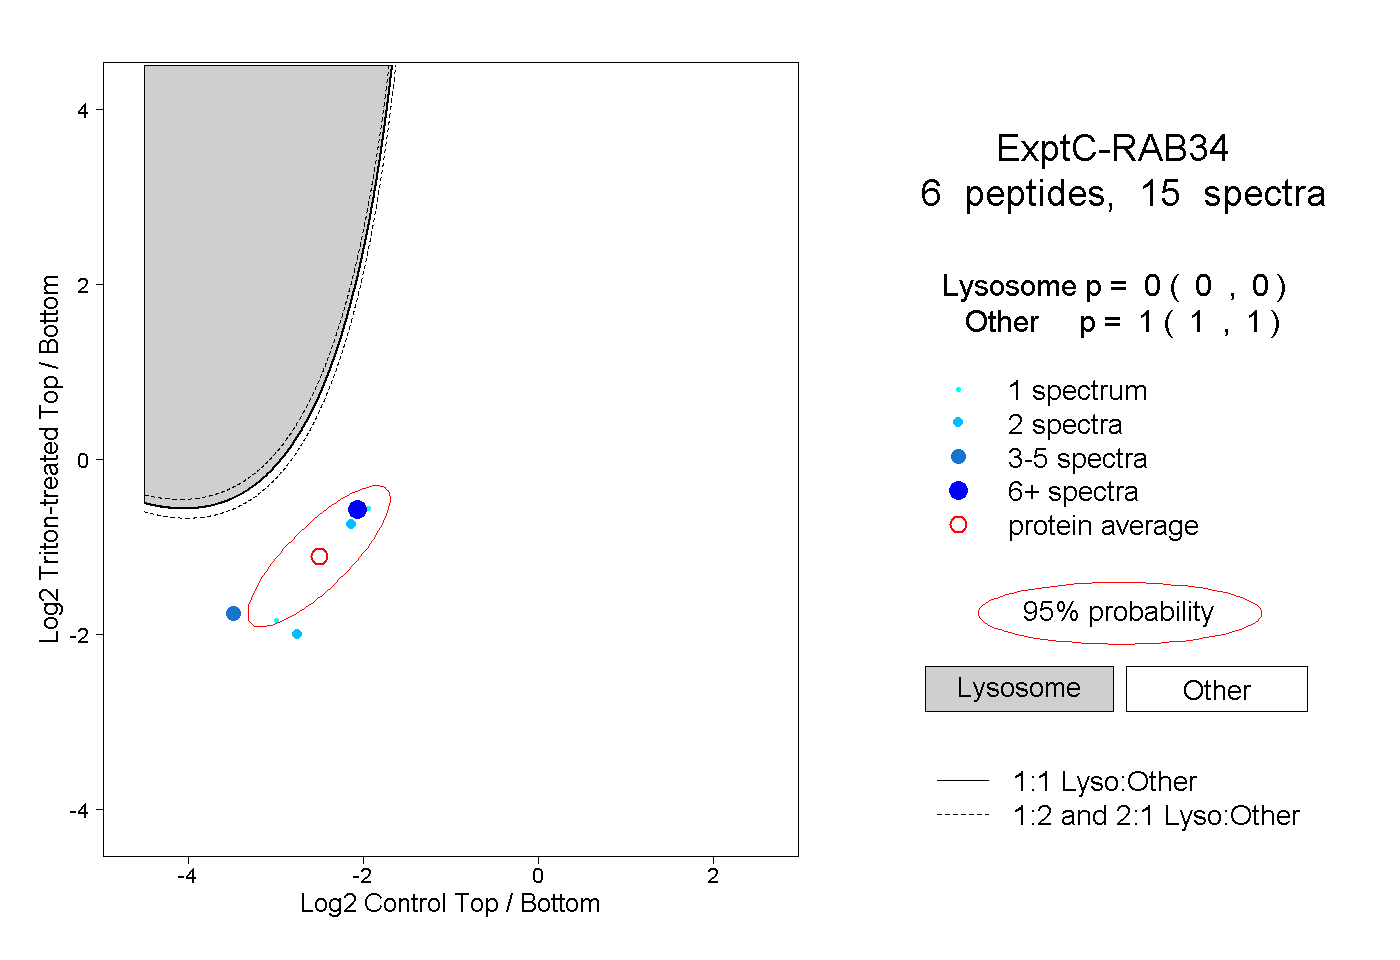 |
0.000 0.000 | 0.000 |
1.000 1.000 | 1.000 |
||||||||
| Plot | Lyso | Other | |||||||||||
| Expt D |
2 peptides |
4 spectra |
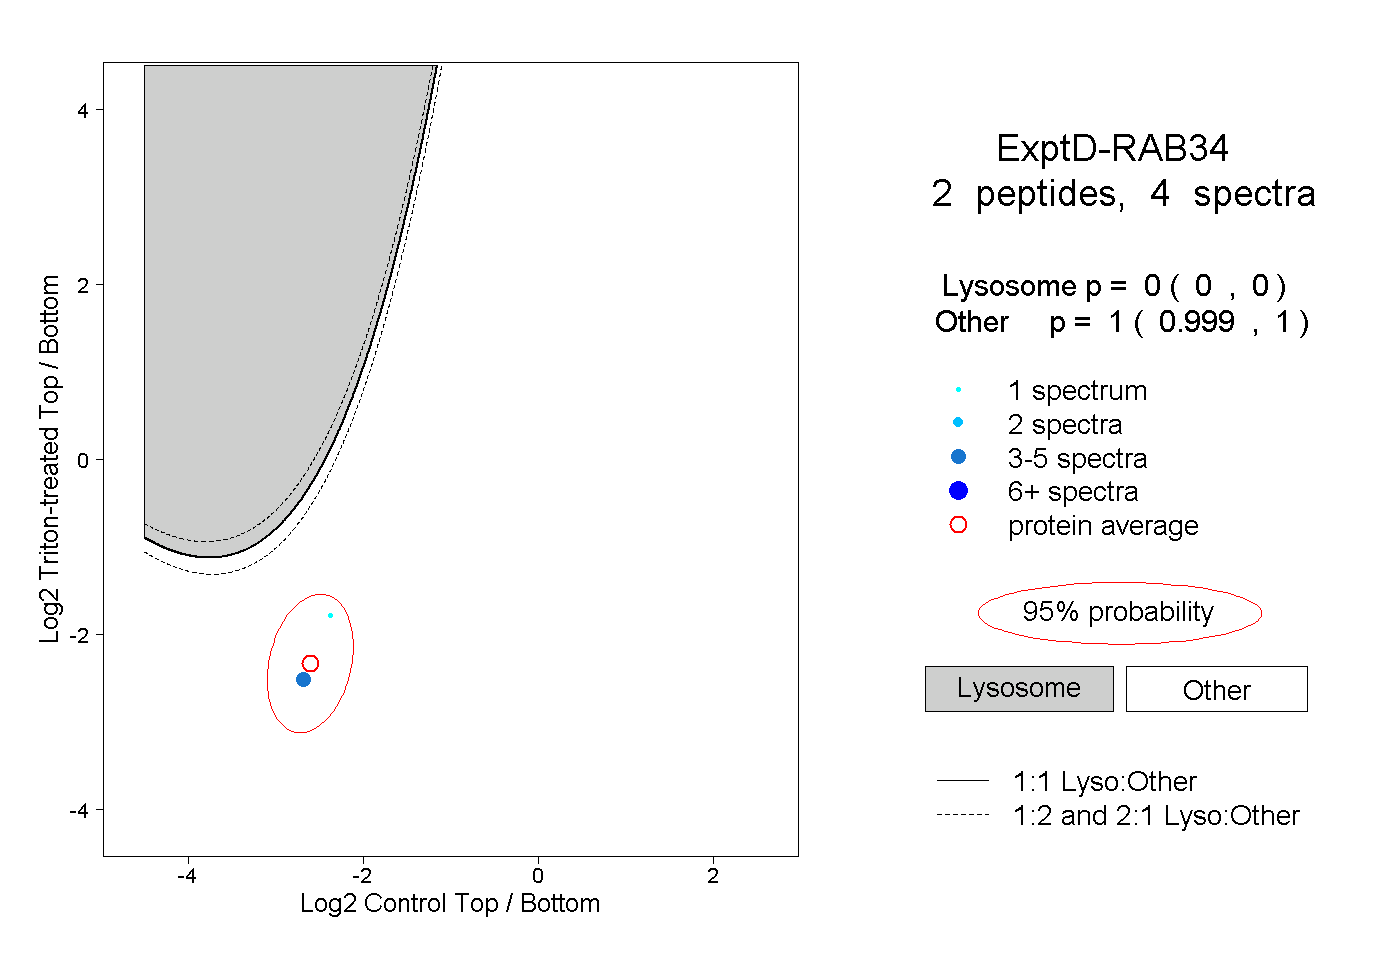 |
0.000 0.000 | 0.000 |
1.000 0.999 | 1.000 |