 2
2peptides
spectra
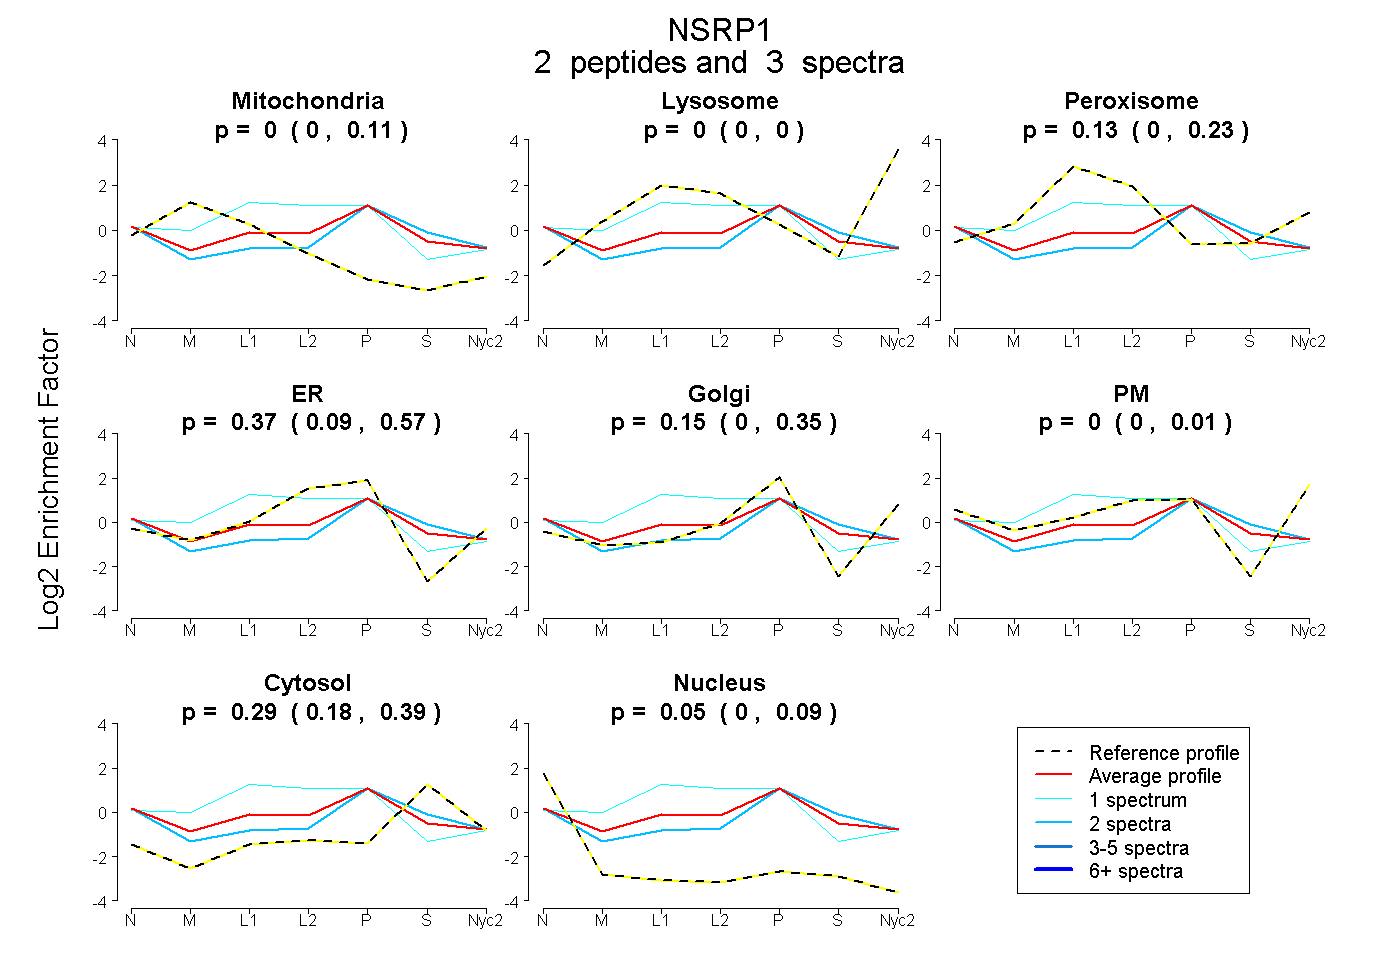
0.000 | 0.106
0.000 | 0.000
0.000 | 0.235
0.087 | 0.566
0.000 | 0.352
0.000 | 0.014
0.185 | 0.392
0.000 | 0.089
| Plot | Mito | Lyso | Perox | ER | Golgi | PM | Cytosol | Nucleus | |||||
| Expt A |
2 peptides |
3 spectra |
|
0.000 0.000 | 0.106 |
0.000 0.000 | 0.000 |
0.132 0.000 | 0.235 |
0.368 0.087 | 0.566 |
0.152 0.000 | 0.352 |
0.000 0.000 | 0.014 |
0.293 0.185 | 0.392 |
0.055 0.000 | 0.089 |
| 1 spectrum, MAPGLR | 0.113 | 0.000 | 0.332 | 0.530 | 0.000 | 0.000 | 0.015 | 0.009 | ||
| 2 spectra, DLSGFYR | 0.000 | 0.000 | 0.006 | 0.206 | 0.316 | 0.000 | 0.427 | 0.045 |
| Plot | Lyso | Other | |||||||||||
| Expt C |
2 peptides |
6 spectra |
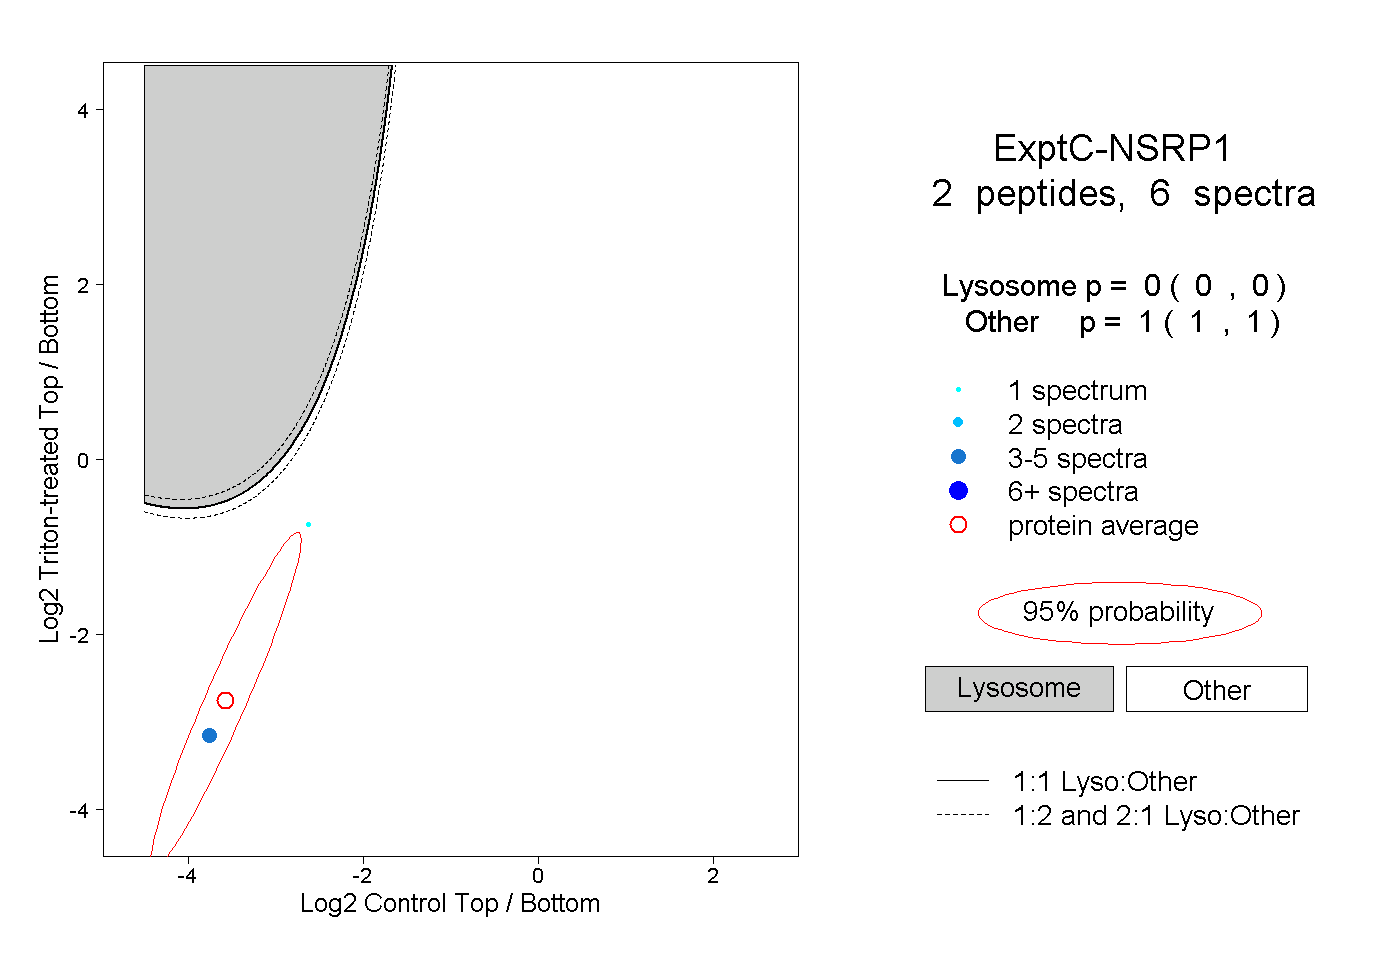 |
0.000 0.000 | 0.000 |
1.000 1.000 | 1.000 |