 2
2peptides
spectra
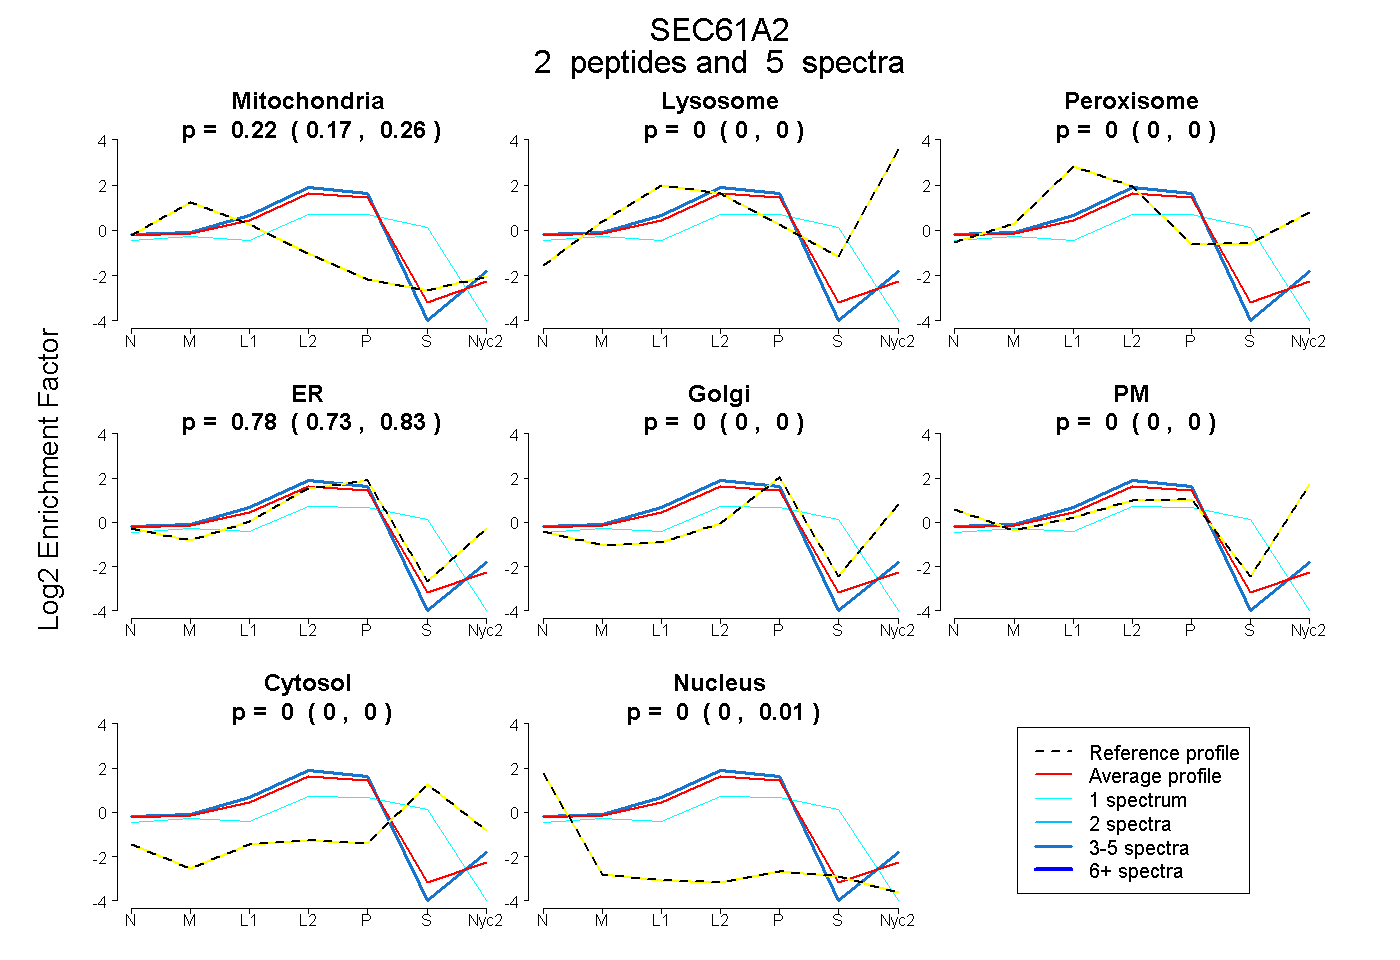
0.166 | 0.256
0.000 | 0.000
0.000 | 0.000
0.733 | 0.826
0.000 | 0.000
0.000 | 0.000
0.000 | 0.000
0.000 | 0.011
1peptide
spectra
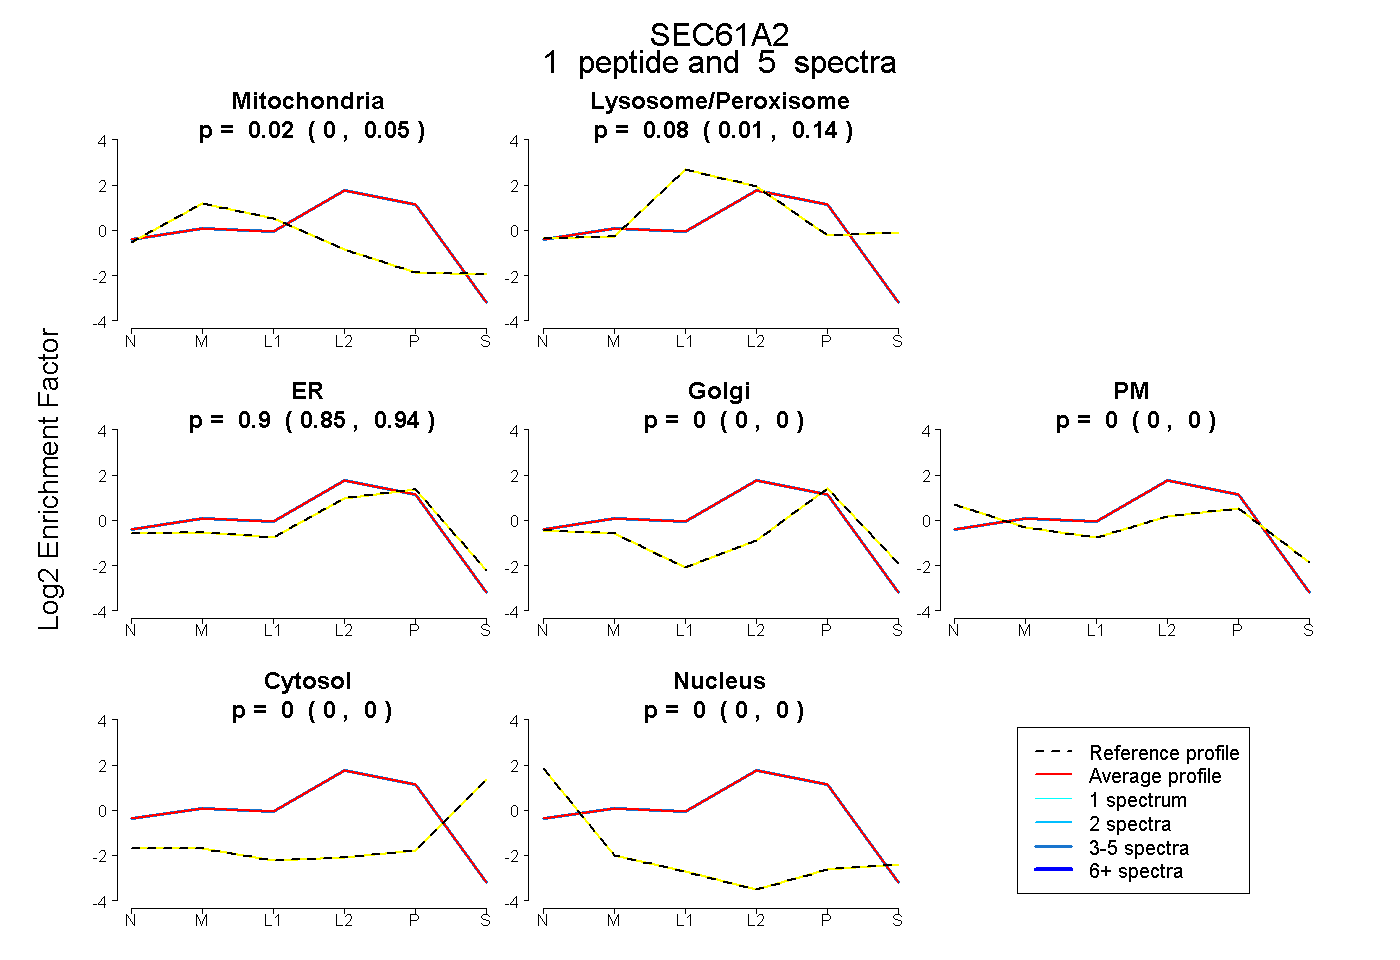
0.000 | 0.053
0.008 | 0.141
0.845 | 0.938
0.000 | 0.000
0.000 | 0.000
0.000 | 0.000
0.000 | 0.000
2peptides
spectra
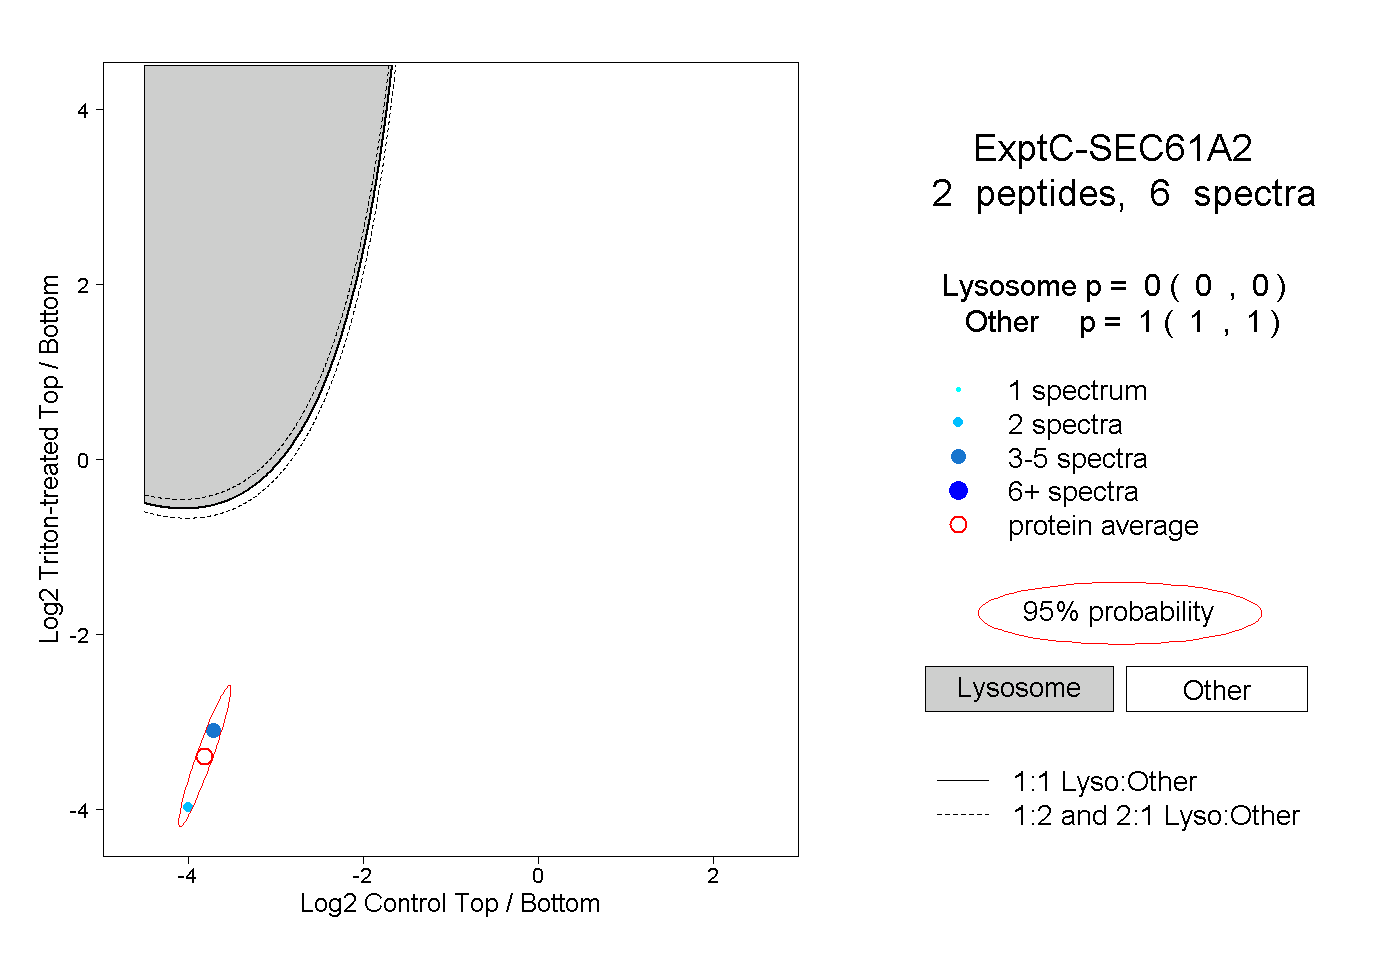
0.000 | 0.000
1.000 | 1.000