 3
3peptides
spectra
0.679 | 0.729
0.018 | 0.068
0.000 | 0.000
0.000 | 0.000
0.000 | 0.000
0.222 | 0.271
0.000 | 0.000
0.000 | 0.000
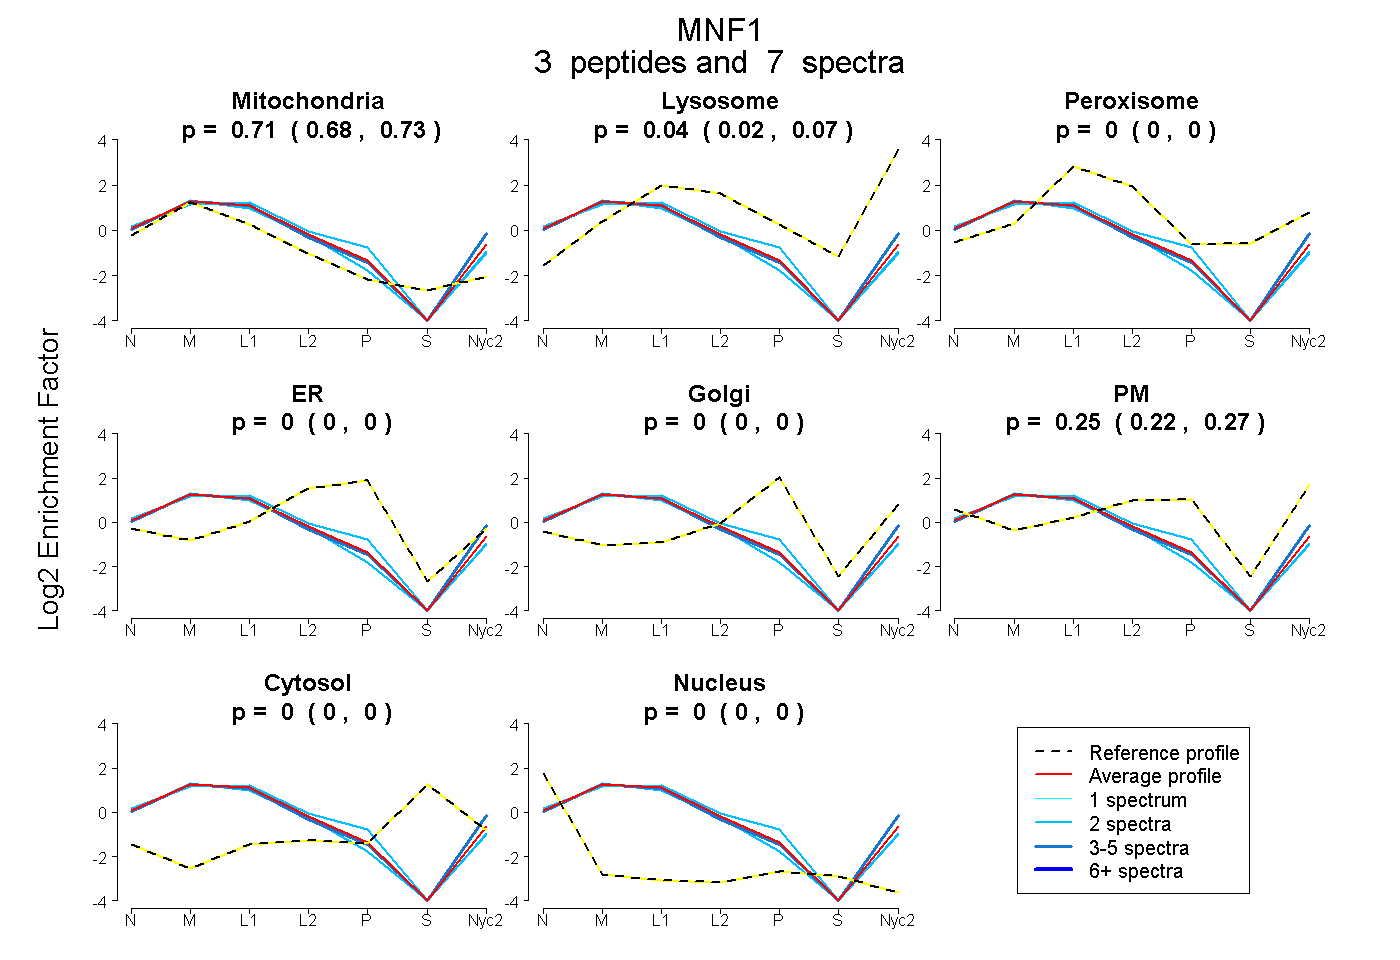
| Plot | Mito | Lyso | Perox | ER | Golgi | PM | Cytosol | Nucleus | |||||
| Expt A |
3 peptides |
7 spectra |
|
0.705 0.679 | 0.729 |
0.045 0.018 | 0.068 |
0.000 0.000 | 0.000 |
0.000 0.000 | 0.000 |
0.000 0.000 | 0.000 |
0.250 0.222 | 0.271 |
0.000 0.000 | 0.000 |
0.000 0.000 | 0.000 |
| 2 spectra, DLGAYLR | 0.796 | 0.033 | 0.000 | 0.000 | 0.000 | 0.171 | 0.000 | 0.000 | ||
| 2 spectra, LILSTDTLEEFQEMNK | 0.648 | 0.000 | 0.002 | 0.116 | 0.000 | 0.234 | 0.000 | 0.000 | ||
| 3 spectra, DTSFSGLSVEEYK | 0.670 | 0.108 | 0.000 | 0.000 | 0.000 | 0.222 | 0.000 | 0.000 |
| Plot | Mito | Lyso or Perox | ER | Golgi | PM | Cytosol | Nucleus | ||||||
| Expt B |
5 peptides |
6 spectra |
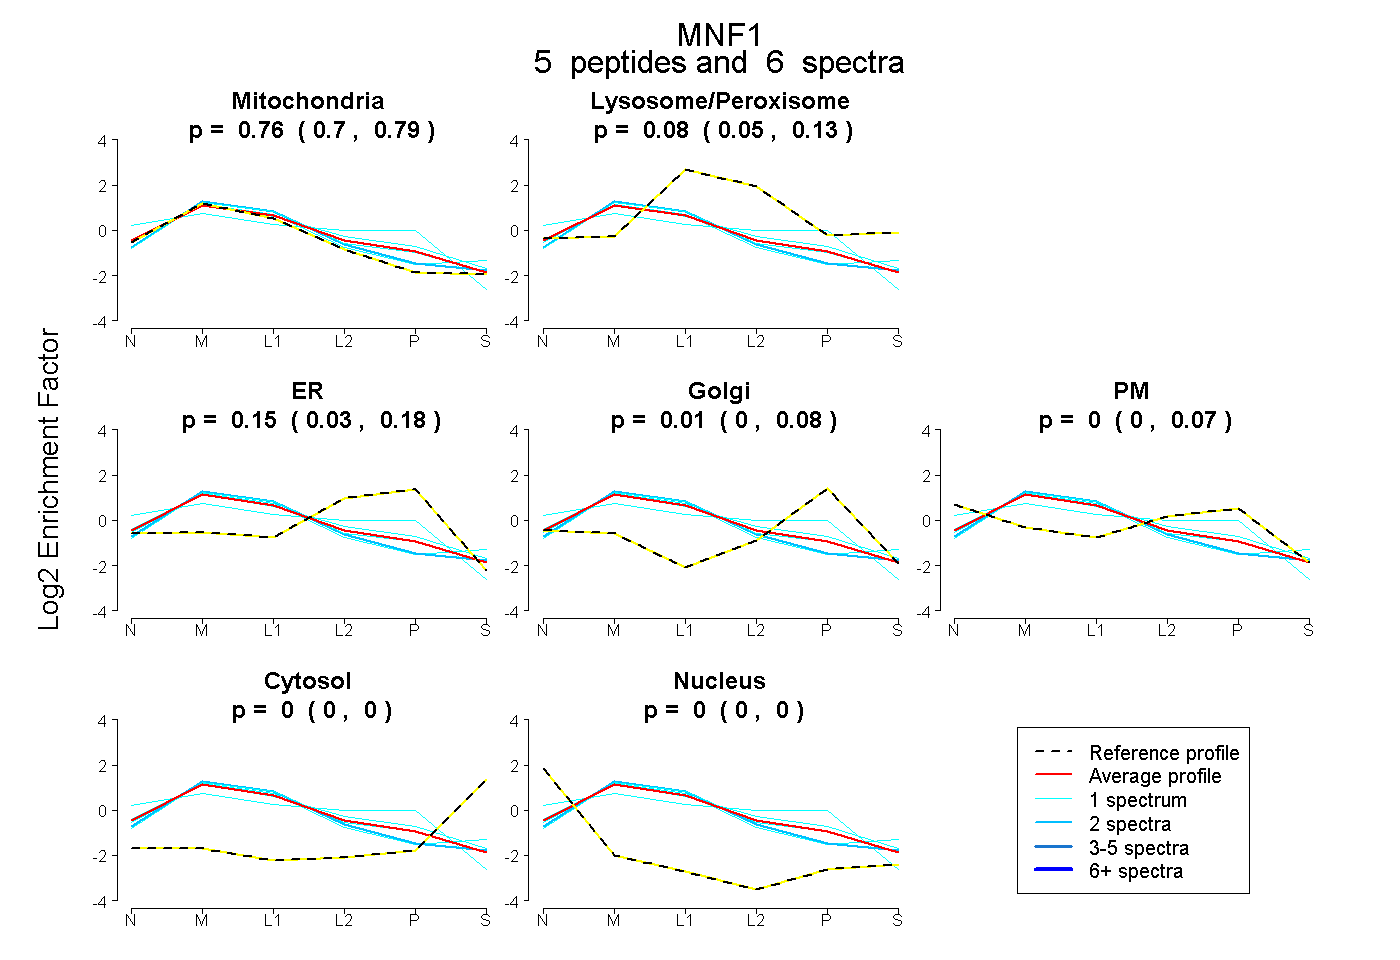 |
0.762 0.700 | 0.795 |
0.083 0.052 | 0.129 |
0.150 0.029 | 0.180 |
0.006 0.000 | 0.079 |
0.000 0.000 | 0.070 |
0.000 0.000 | 0.000 |
0.000 0.000 | 0.000 |
|||
| Plot | Lyso | Other | |||||||||||
| Expt C |
7 peptides |
47 spectra |
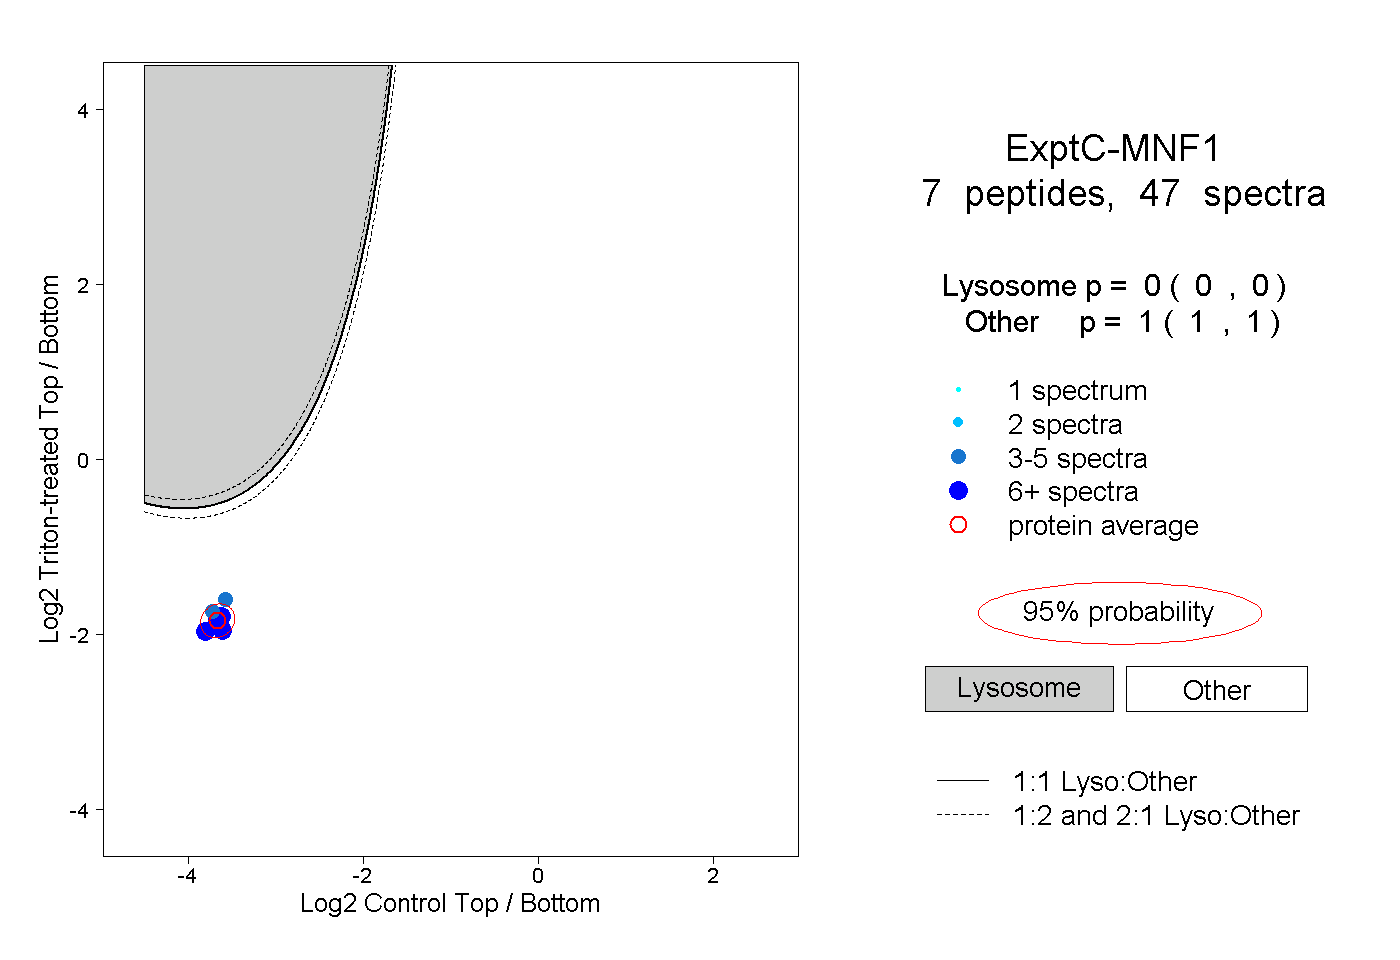 |
0.000 0.000 | 0.000 |
1.000 1.000 | 1.000 |
||||||||
| Plot | Lyso | Other | |||||||||||
| Expt D |
5 peptides |
12 spectra |
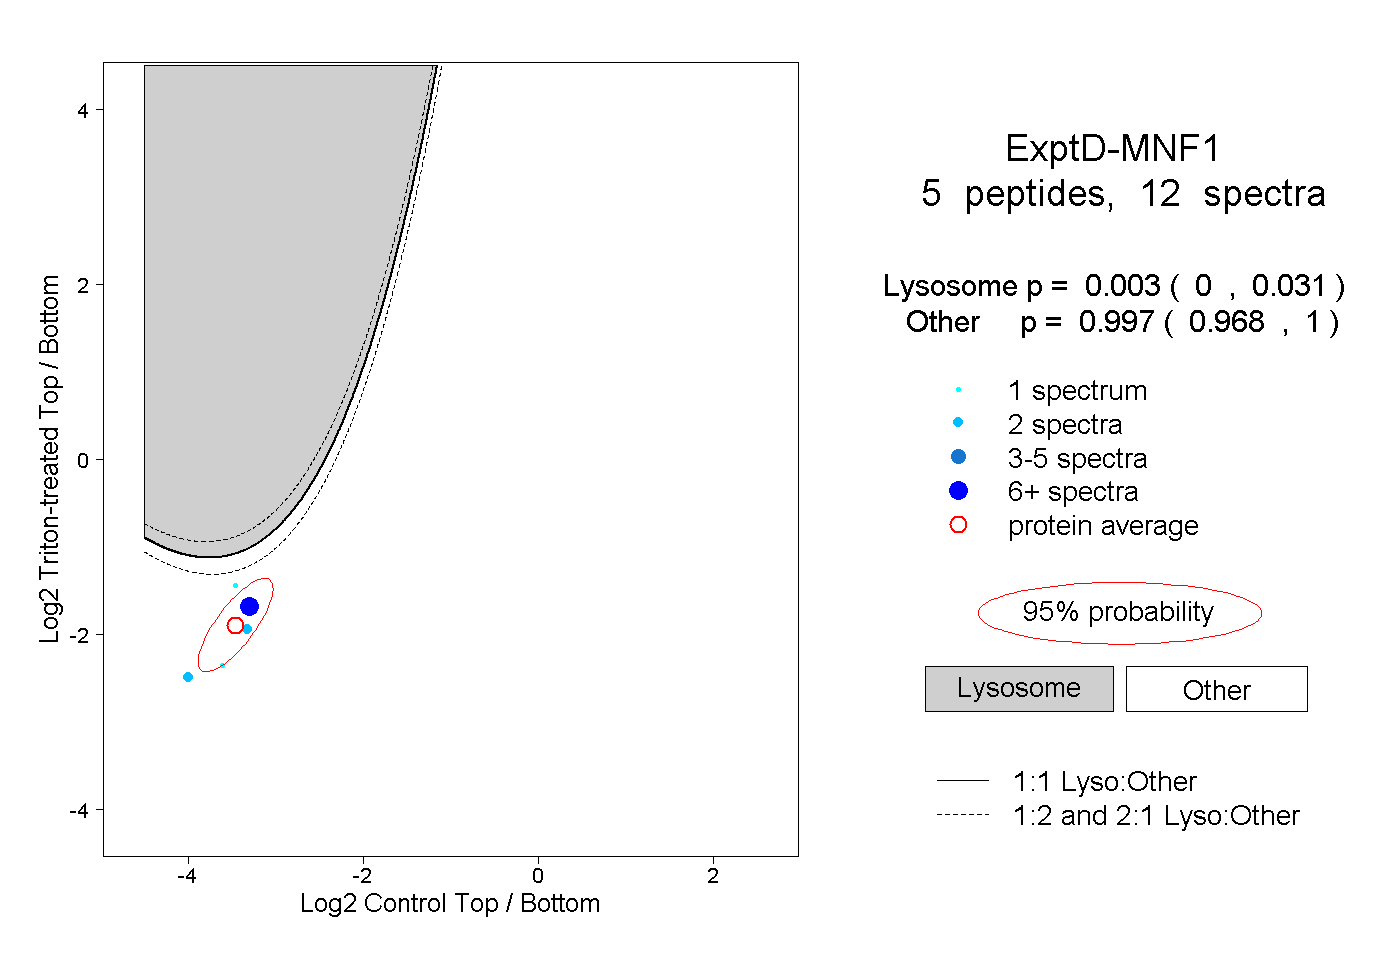 |
0.003 0.000 | 0.031 |
0.997 0.968 | 1.000 |