 3
3peptides
spectra
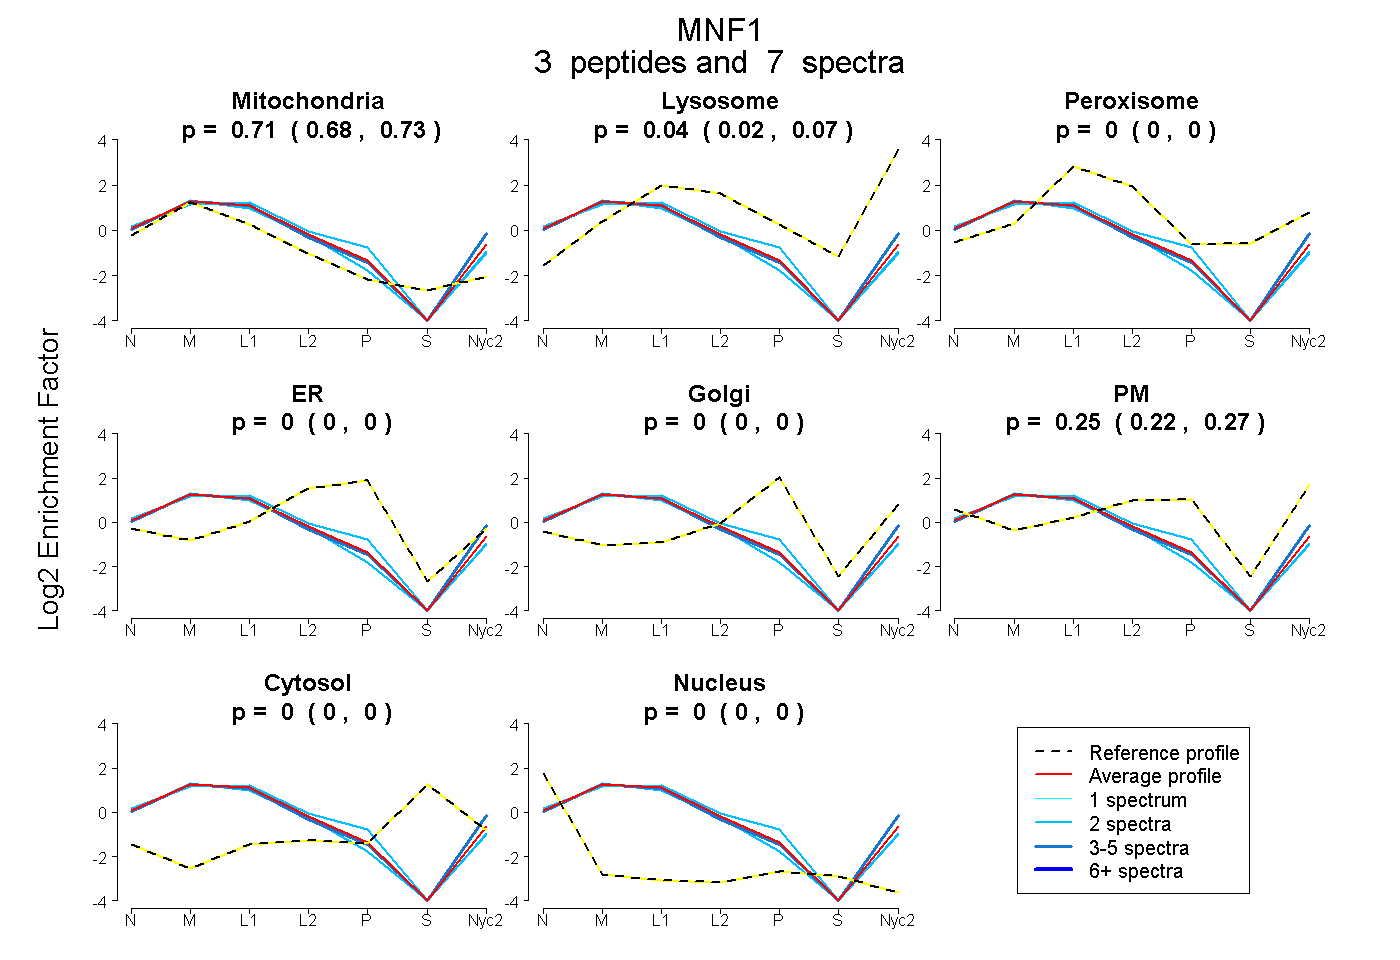
0.679 | 0.729
0.018 | 0.068
0.000 | 0.000
0.000 | 0.000
0.000 | 0.000
0.222 | 0.271
0.000 | 0.000
0.000 | 0.000
5peptides
spectra
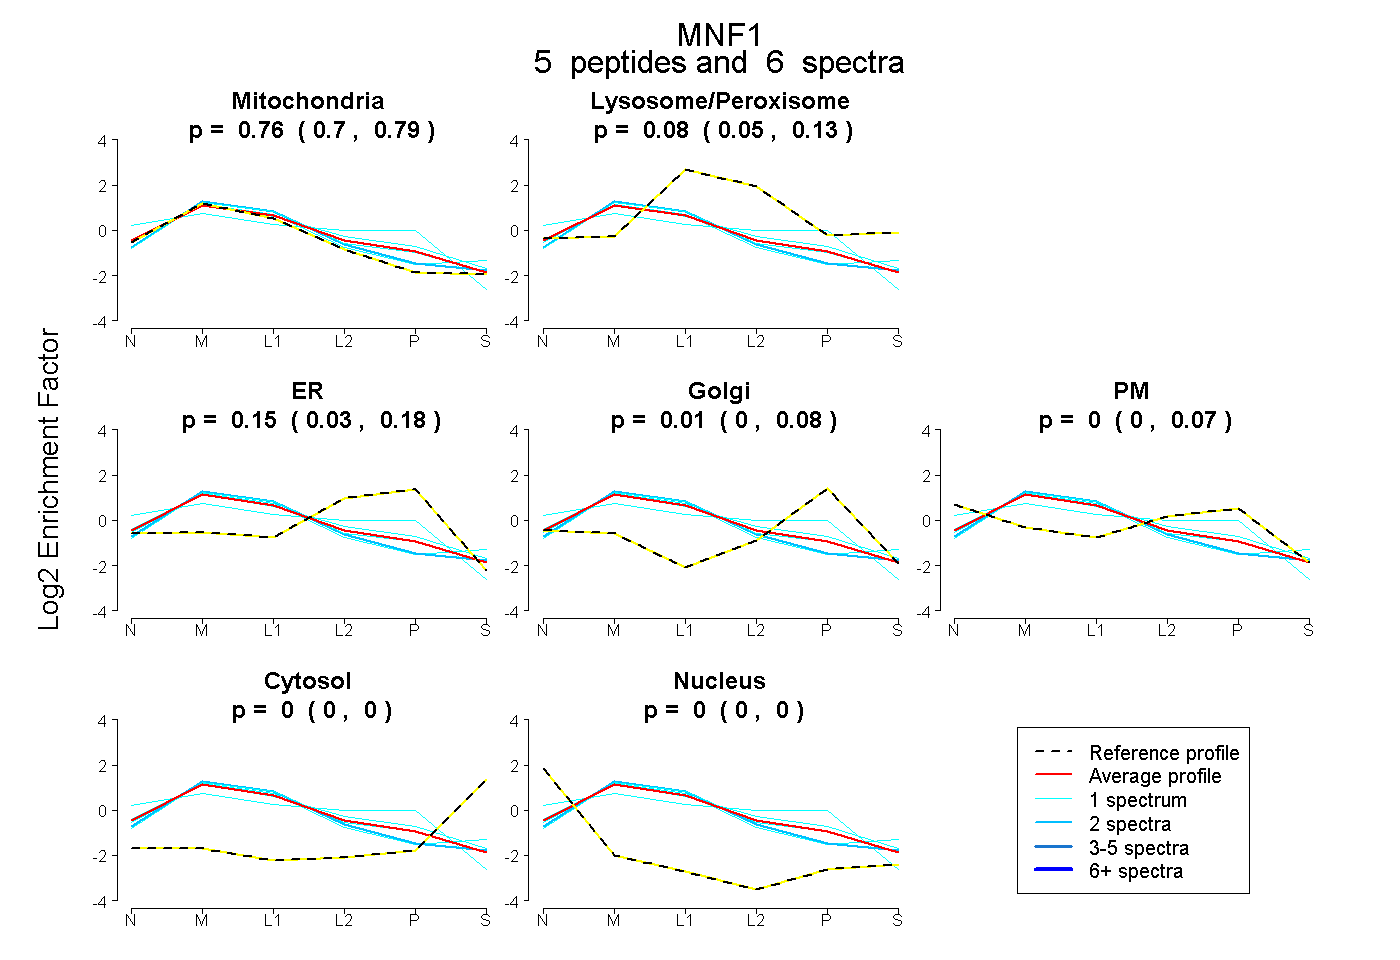
0.700 | 0.795
0.052 | 0.129
0.029 | 0.180
0.000 | 0.079
0.000 | 0.070
0.000 | 0.000
0.000 | 0.000
7peptides
spectra
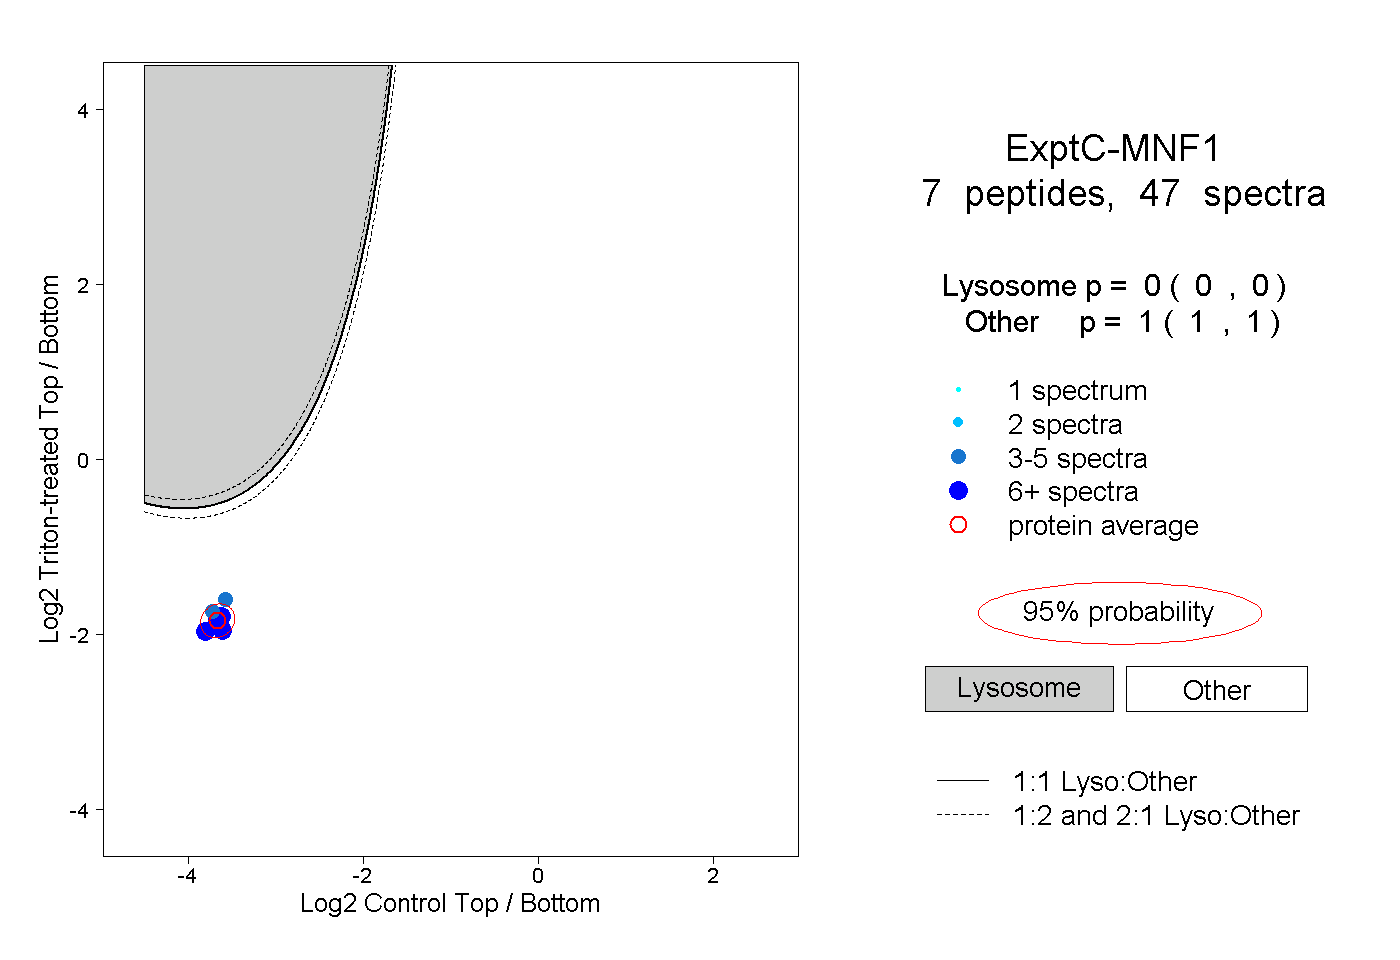
0.000 | 0.000
1.000 | 1.000
5peptides
spectra
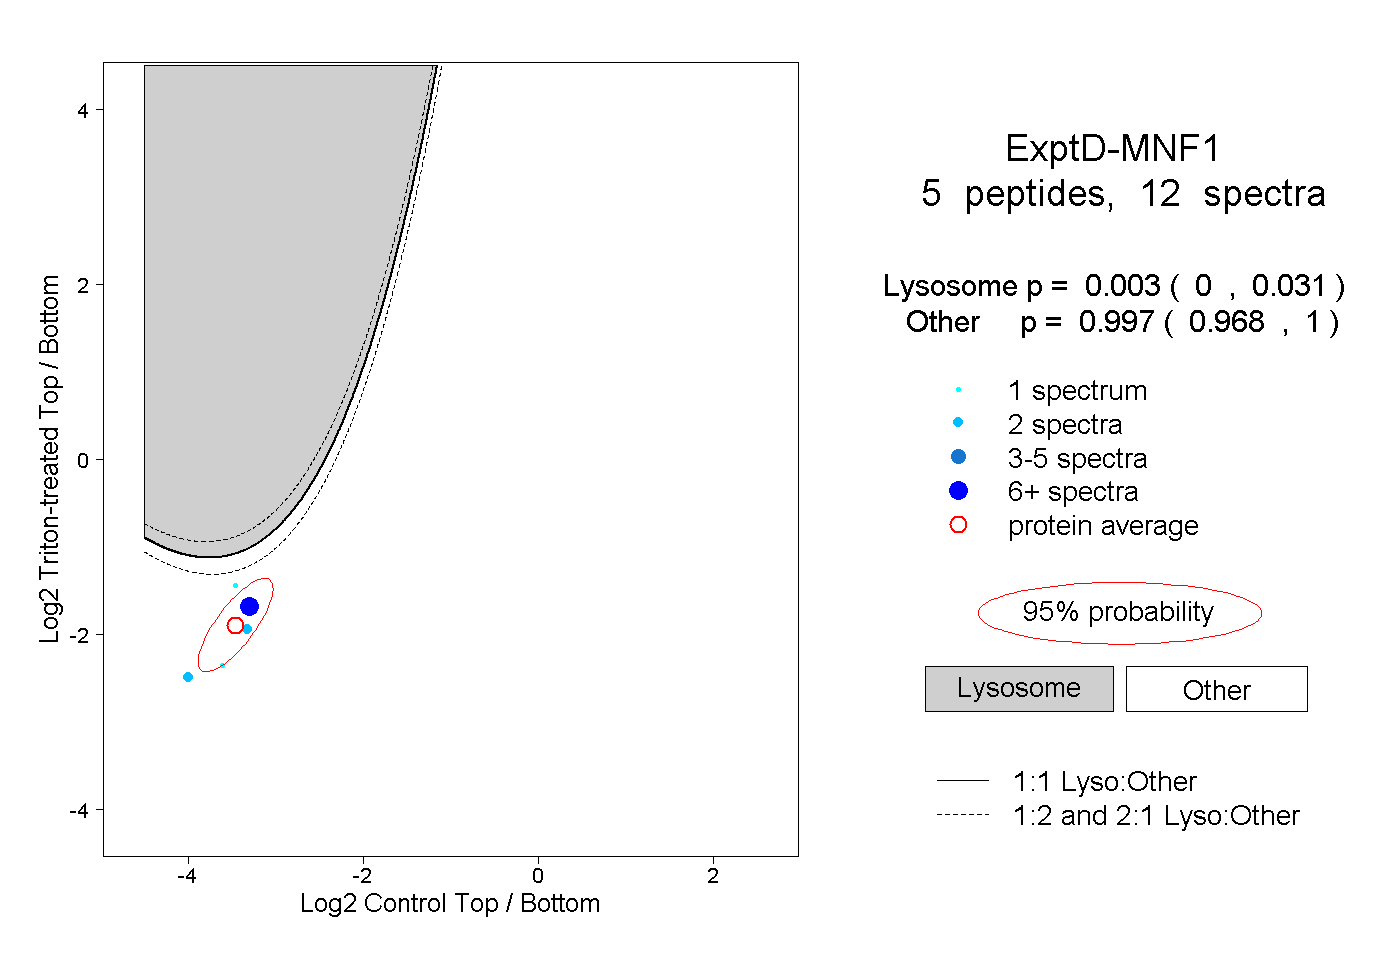
0.000 | 0.031
0.968 | 1.000