 2
2peptides
spectra

0.000 | 0.000
0.000 | 0.067
0.000 | 0.090
0.086 | 0.360
0.000 | 0.037
0.520 | 0.806
0.000 | 0.073
0.000 | 0.009
1peptide
spectra
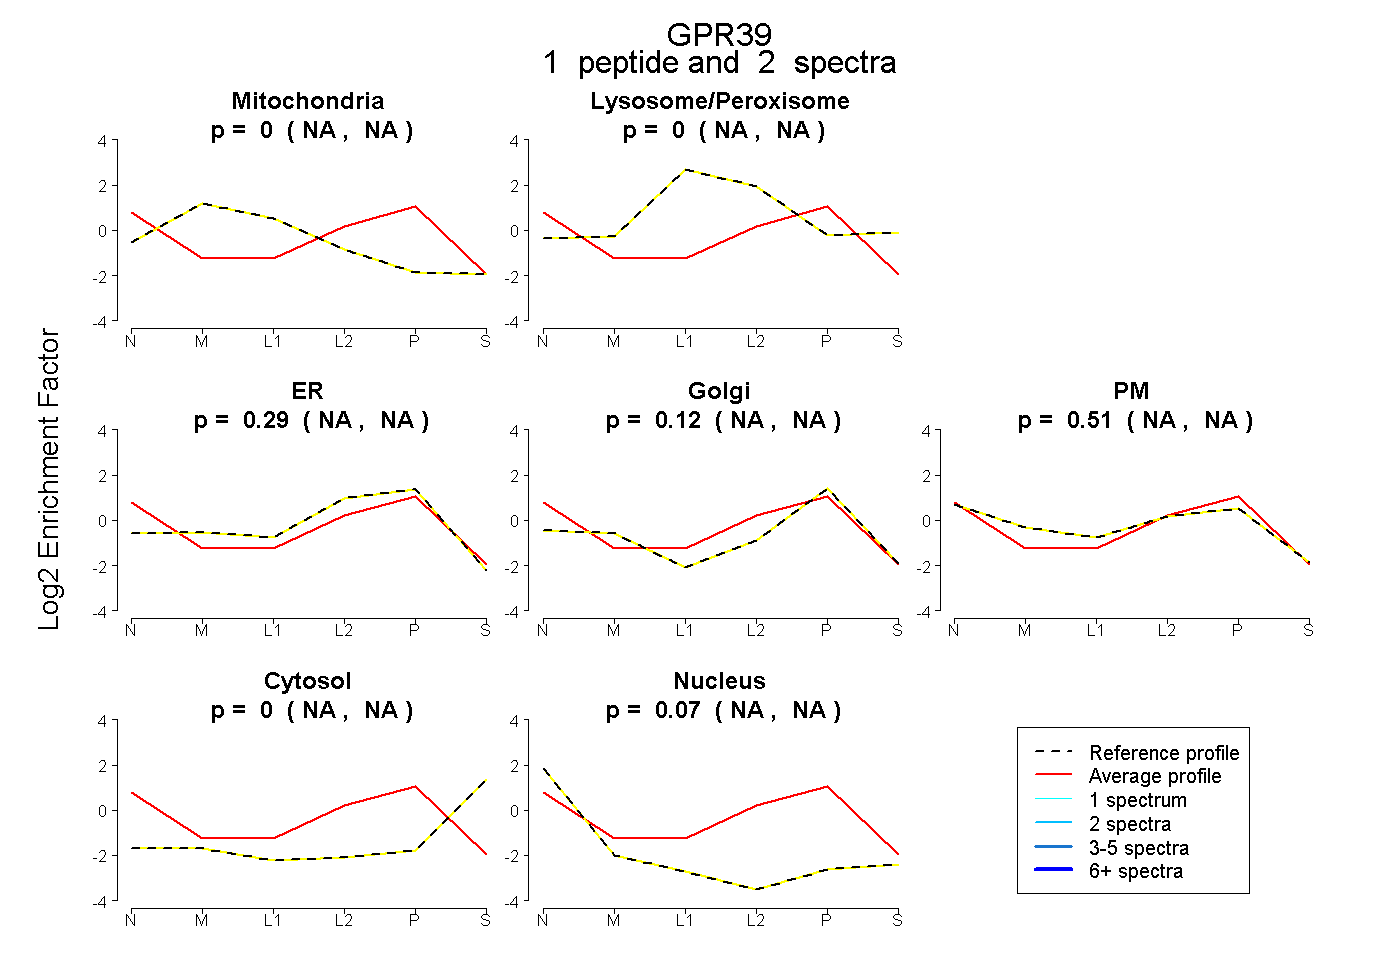
NA | NA
NA | NA
NA | NA
NA | NA
NA | NA
NA | NA
NA | NA
2peptides
spectra
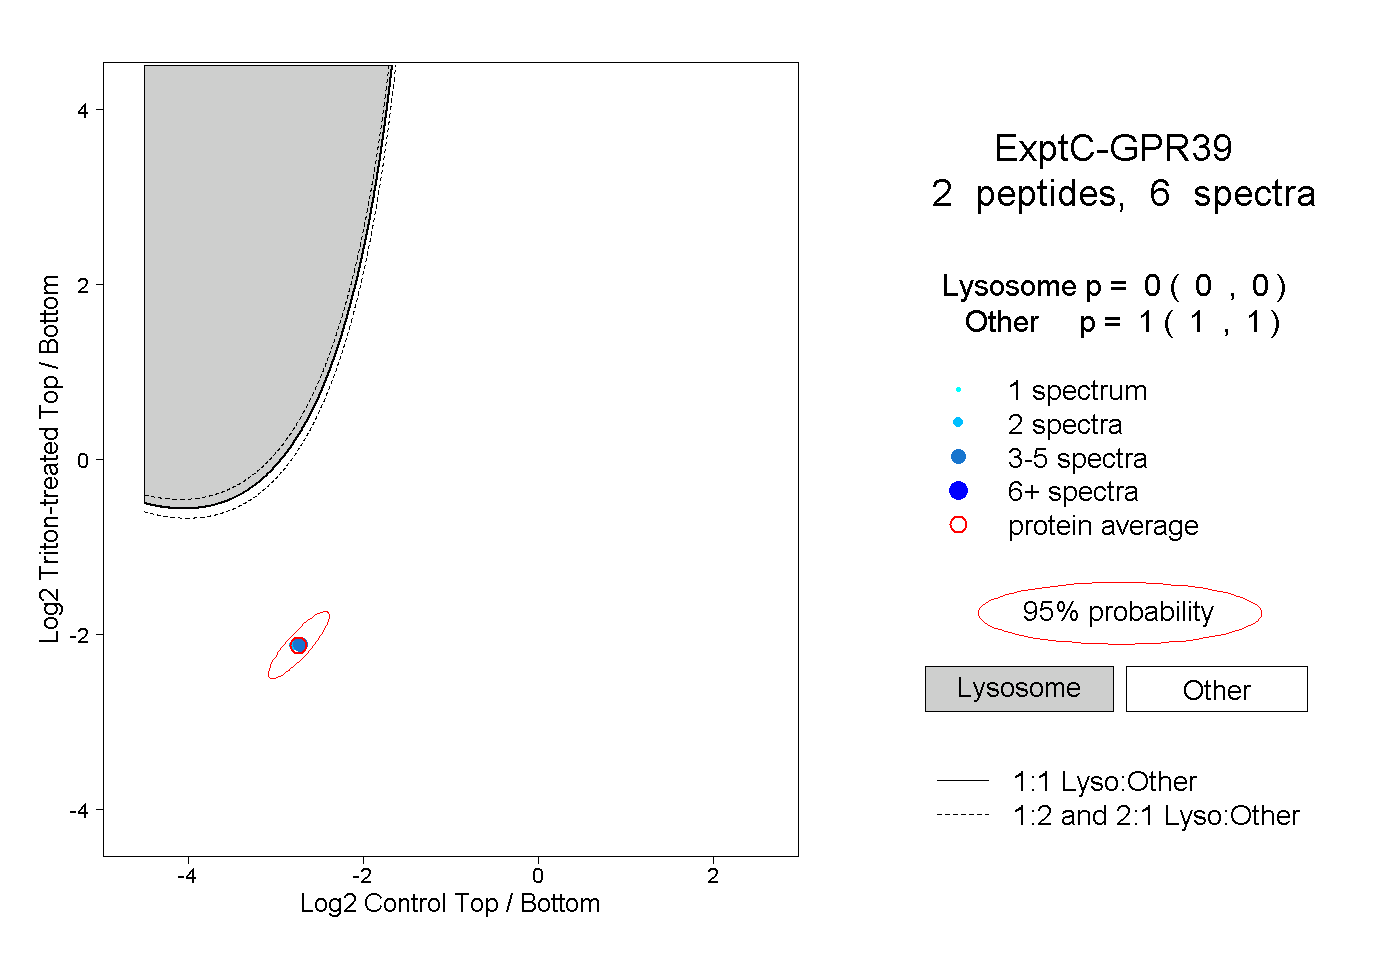
0.000 | 0.000
1.000 | 1.000
2peptides
spectra
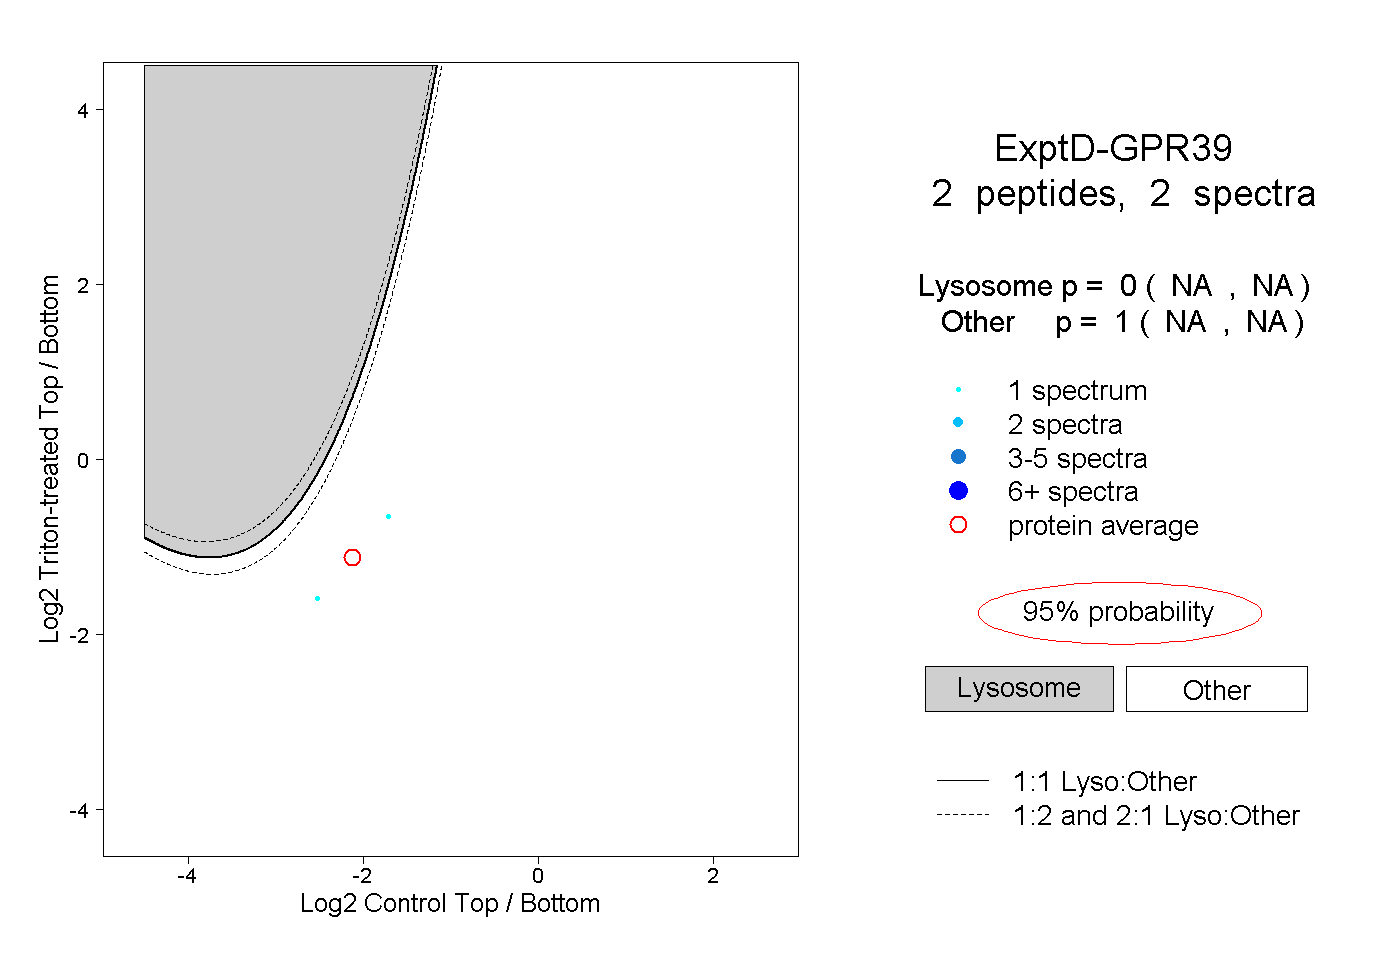
NA | NA
NA | NA