 5
5peptides
spectra
0.000 | 0.000
0.000 | 0.000
0.281 | 0.294
0.000 | 0.000
0.000 | 0.000
0.000 | 0.000
0.705 | 0.718
0.000 | 0.000
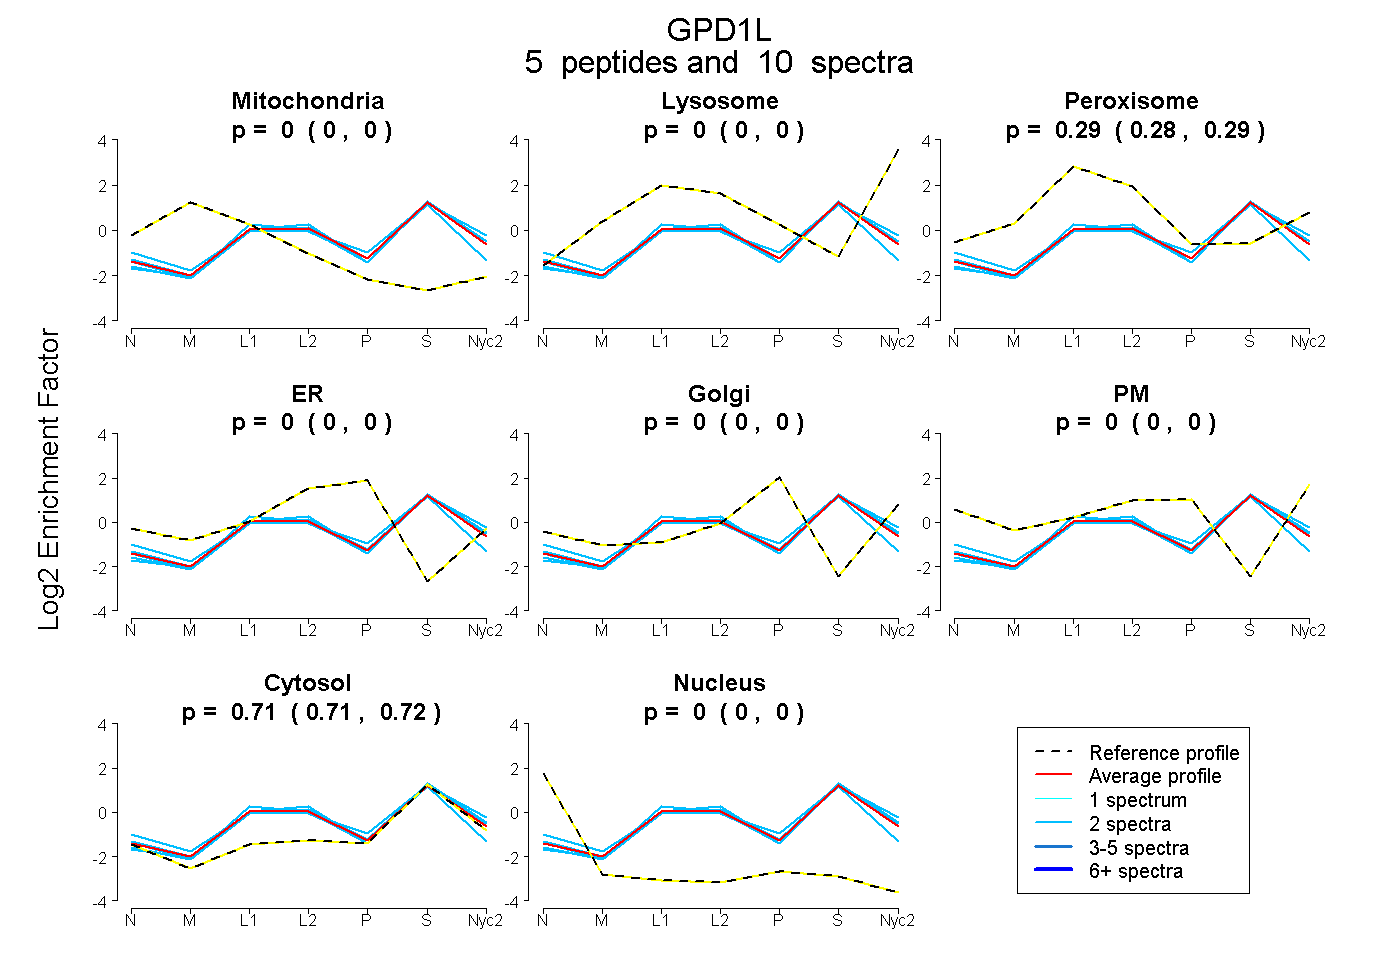
| Plot | Mito | Lyso | Perox | ER | Golgi | PM | Cytosol | Nucleus | |||||
| Expt A |
5 peptides |
10 spectra |
|
0.000 0.000 | 0.000 |
0.000 0.000 | 0.000 |
0.288 0.281 | 0.294 |
0.000 0.000 | 0.000 |
0.000 0.000 | 0.000 |
0.000 0.000 | 0.000 |
0.712 0.705 | 0.718 |
0.000 0.000 | 0.000 |
| 2 spectra, LISDIIR | 0.000 | 0.000 | 0.275 | 0.000 | 0.000 | 0.000 | 0.725 | 0.000 | ||
| 2 spectra, LQGPQTSAEVYR | 0.000 | 0.000 | 0.296 | 0.000 | 0.000 | 0.000 | 0.704 | 0.000 | ||
| 2 spectra, ELLQTPNFR | 0.000 | 0.000 | 0.302 | 0.000 | 0.000 | 0.000 | 0.698 | 0.000 | ||
| 2 spectra, MWVFEETVNGR | 0.000 | 0.000 | 0.294 | 0.000 | 0.000 | 0.000 | 0.706 | 0.000 | ||
| 2 spectra, ICDEITGR | 0.003 | 0.000 | 0.275 | 0.000 | 0.000 | 0.000 | 0.710 | 0.013 |
| Plot | Mito | Lyso or Perox | ER | Golgi | PM | Cytosol | Nucleus | ||||||
| Expt B |
3 peptides |
5 spectra |
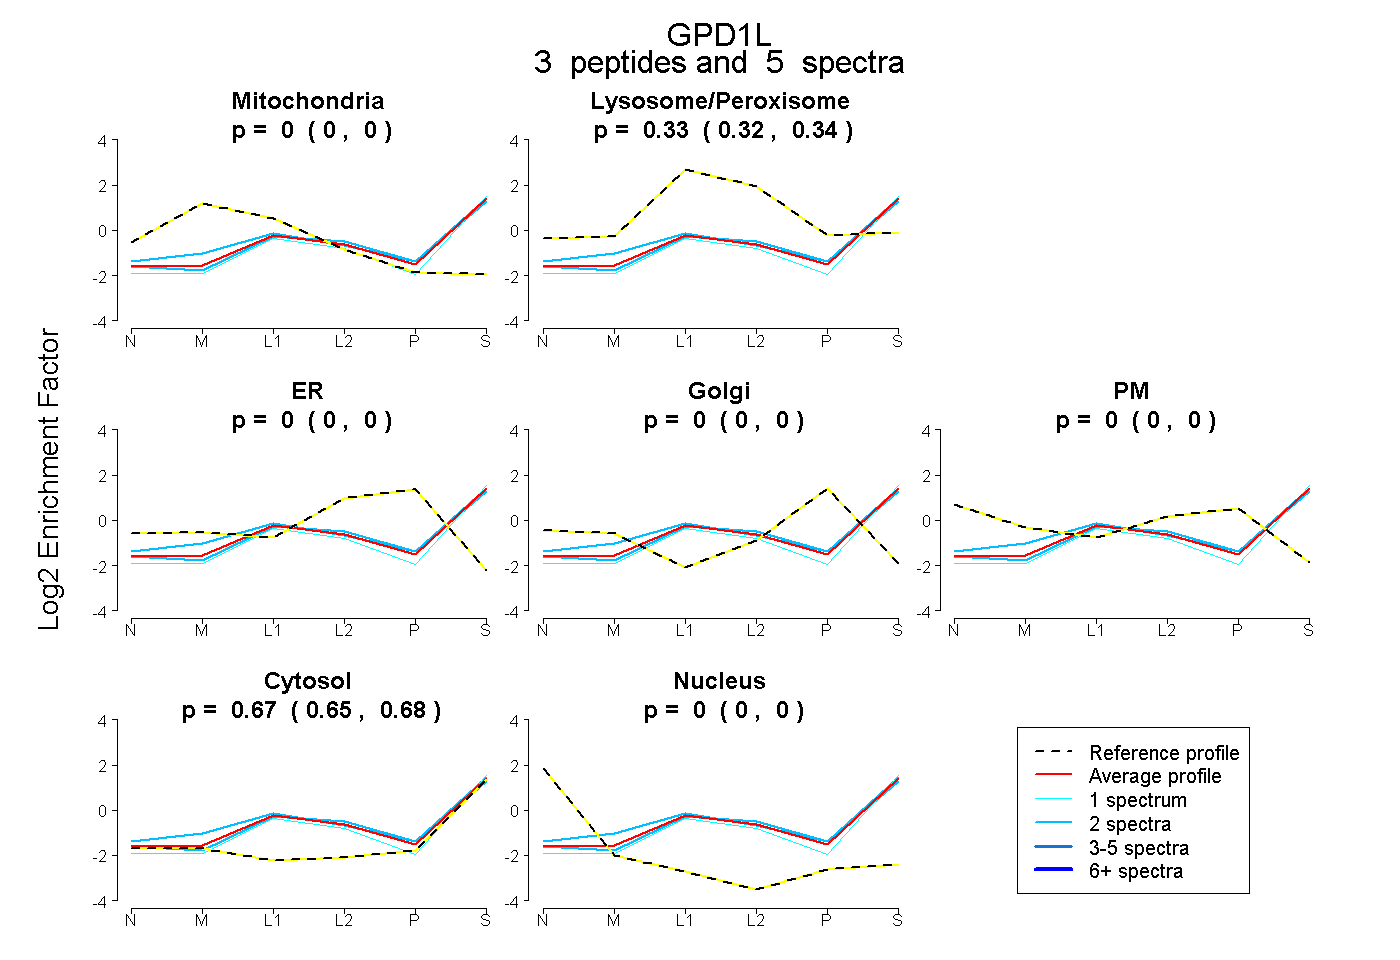 |
0.000 0.000 | 0.000 |
0.333 0.319 | 0.344 |
0.000 0.000 | 0.000 |
0.000 0.000 | 0.000 |
0.000 0.000 | 0.000 |
0.667 0.654 | 0.678 |
0.000 0.000 | 0.000 |
|||
| Plot | Lyso | Other | |||||||||||
| Expt C |
14 peptides |
63 spectra |
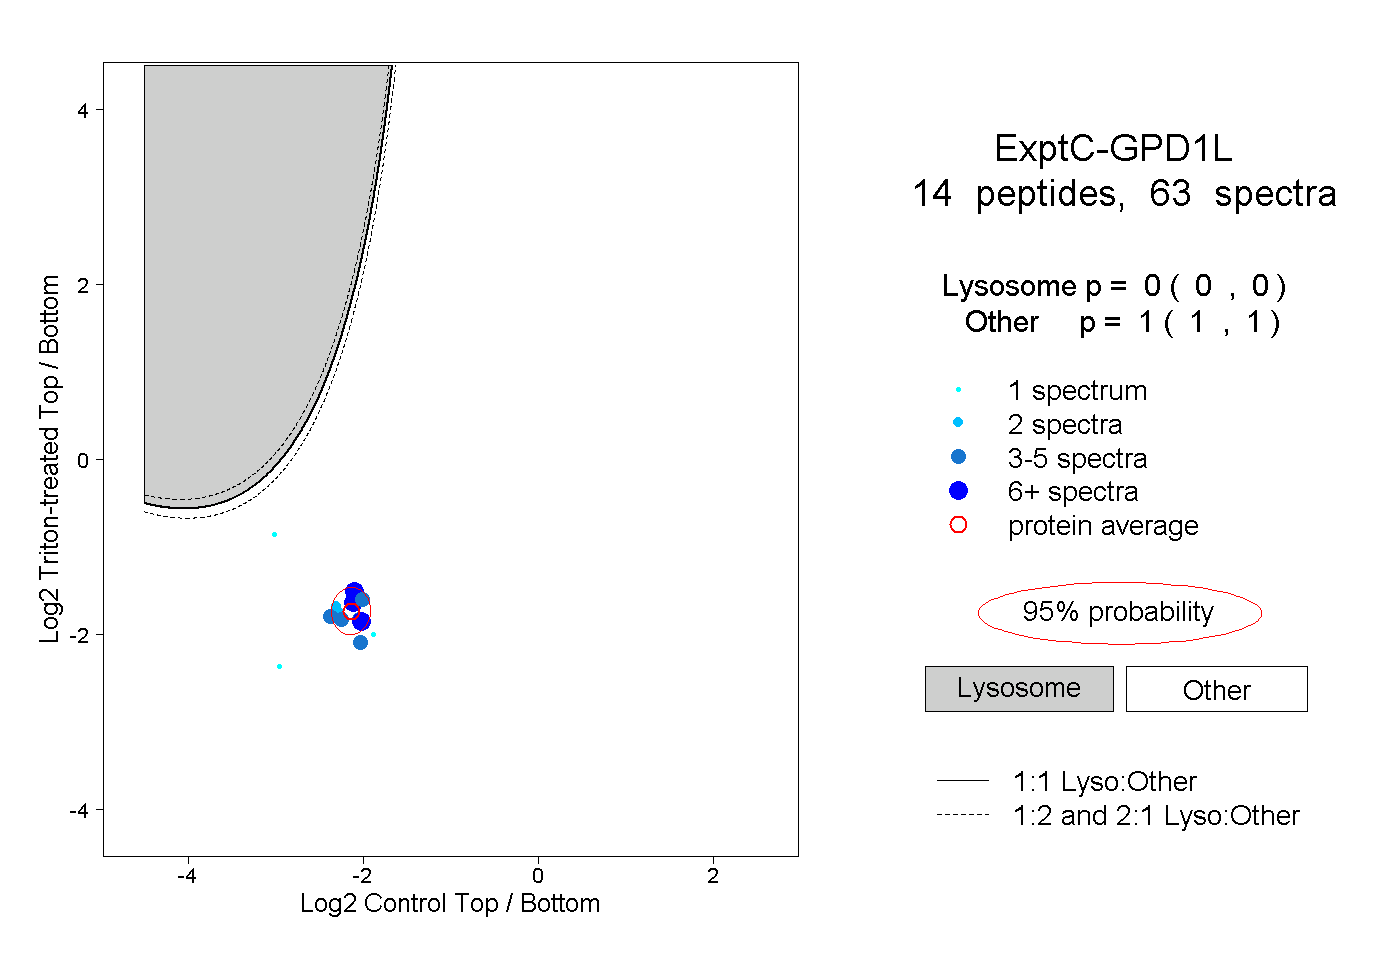 |
0.000 0.000 | 0.000 |
1.000 1.000 | 1.000 |
||||||||
| Plot | Lyso | Other | |||||||||||
| Expt D |
6 peptides |
11 spectra |
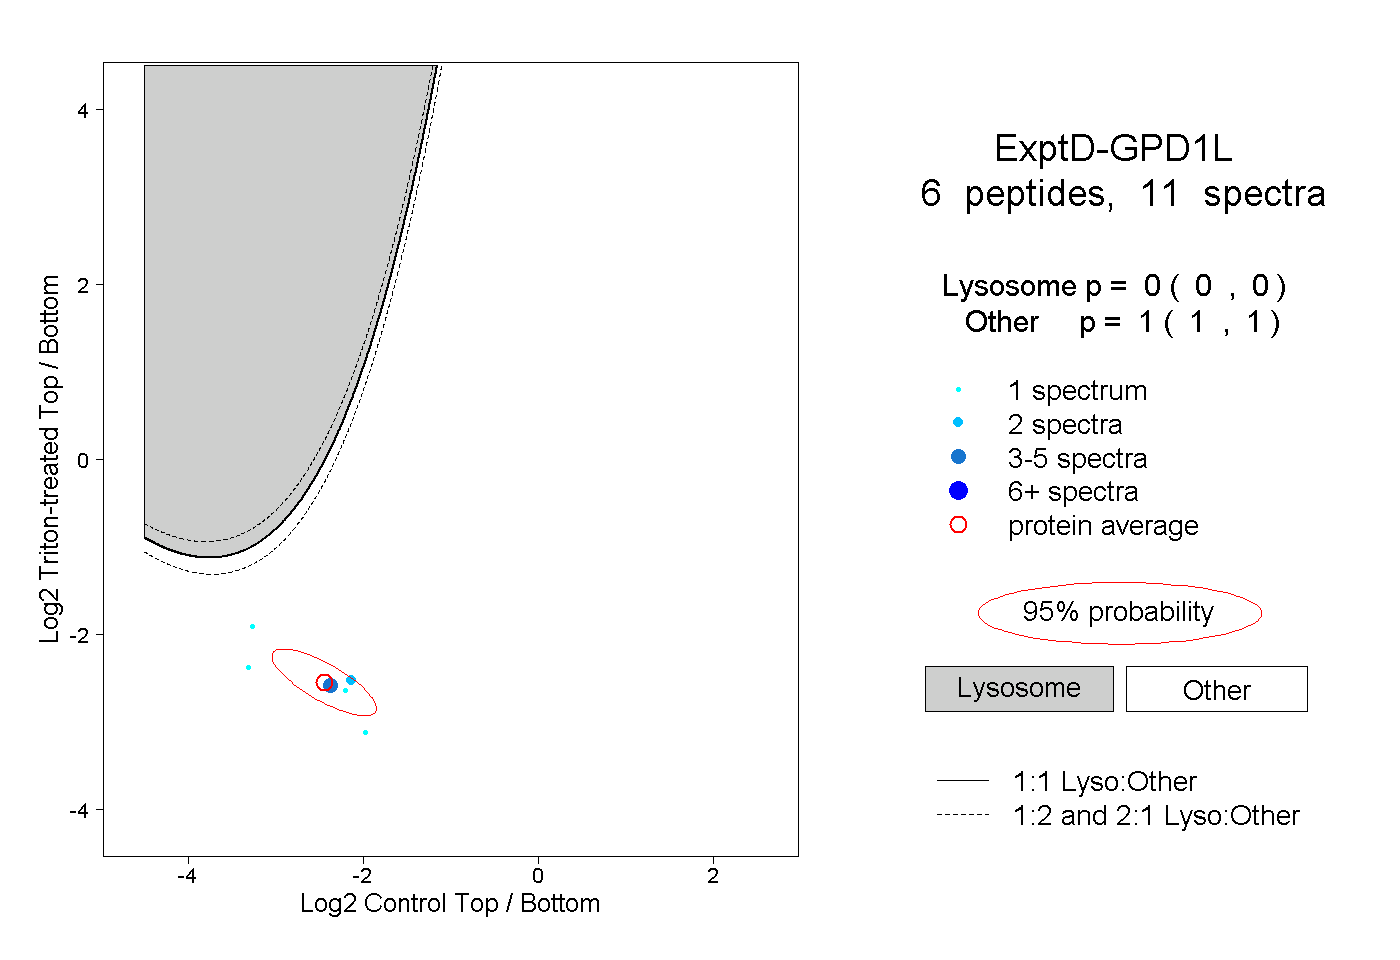 |
0.000 0.000 | 0.000 |
1.000 1.000 | 1.000 |