 2
2peptides
spectra
0.000 | 0.056
0.000 | 0.000
0.000 | 0.000
0.000 | 0.125
0.093 | 0.388
0.000 | 0.018
0.331 | 0.444
0.181 | 0.366
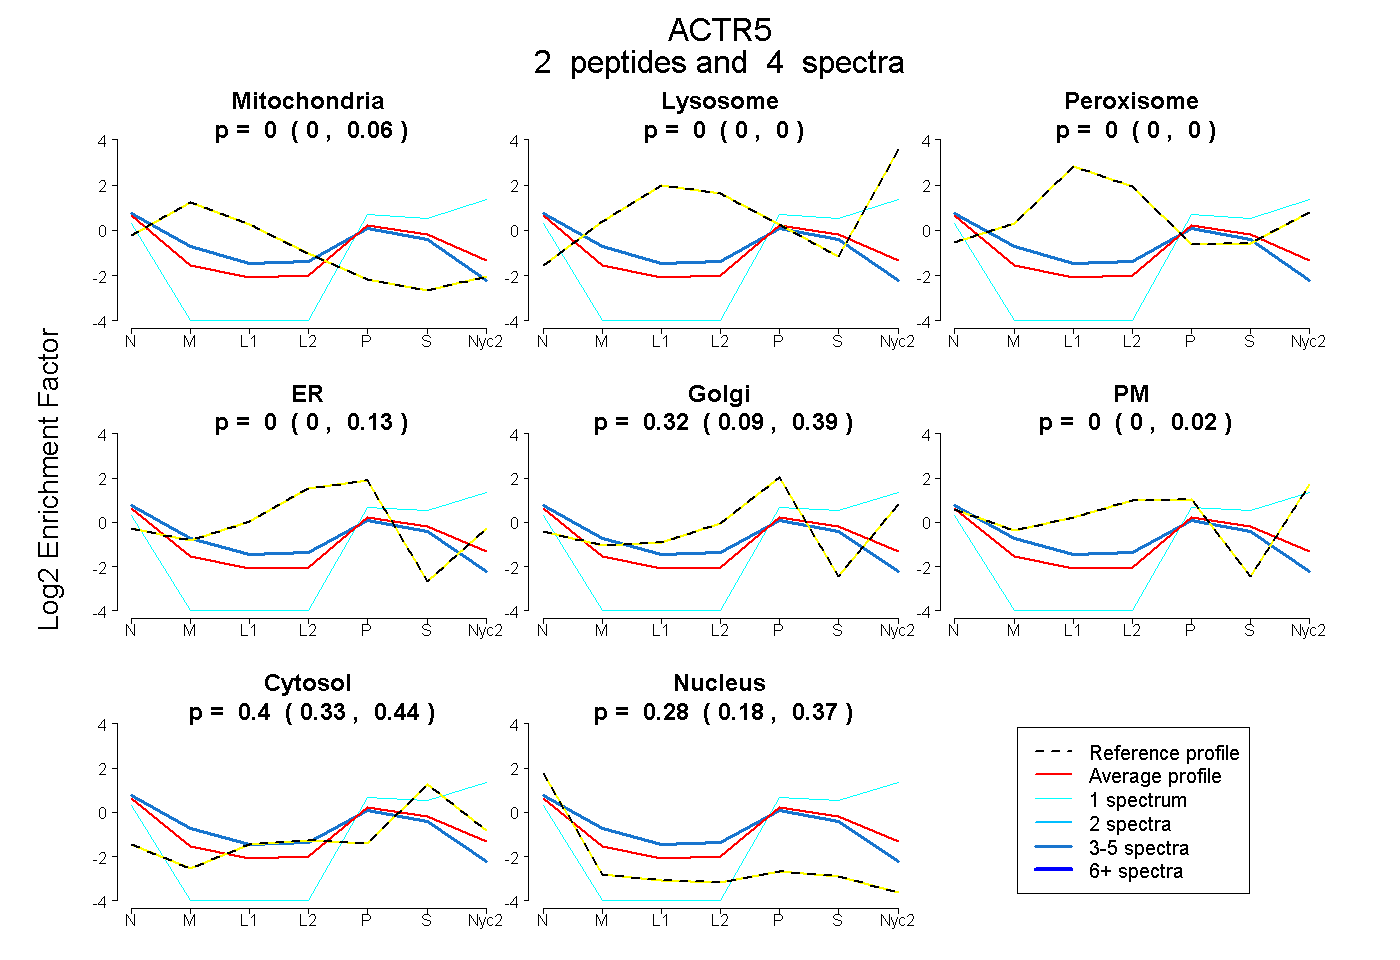
| Plot | Mito | Lyso | Perox | ER | Golgi | PM | Cytosol | Nucleus | |||||
| Expt A |
2 peptides |
4 spectra |
|
0.000 0.000 | 0.056 |
0.000 0.000 | 0.000 |
0.000 0.000 | 0.000 |
0.000 0.000 | 0.125 |
0.321 0.093 | 0.388 |
0.000 0.000 | 0.018 |
0.396 0.331 | 0.444 |
0.282 0.181 | 0.366 |
| 3 spectra, YPGHLAAITLSR | 0.138 | 0.000 | 0.000 | 0.226 | 0.055 | 0.000 | 0.321 | 0.259 | ||
| 1 spectrum, INLGGSQAAGYLQR | 0.000 | 0.000 | 0.000 | 0.000 | 0.214 | 0.000 | 0.595 | 0.191 |