 2
2peptides
spectra
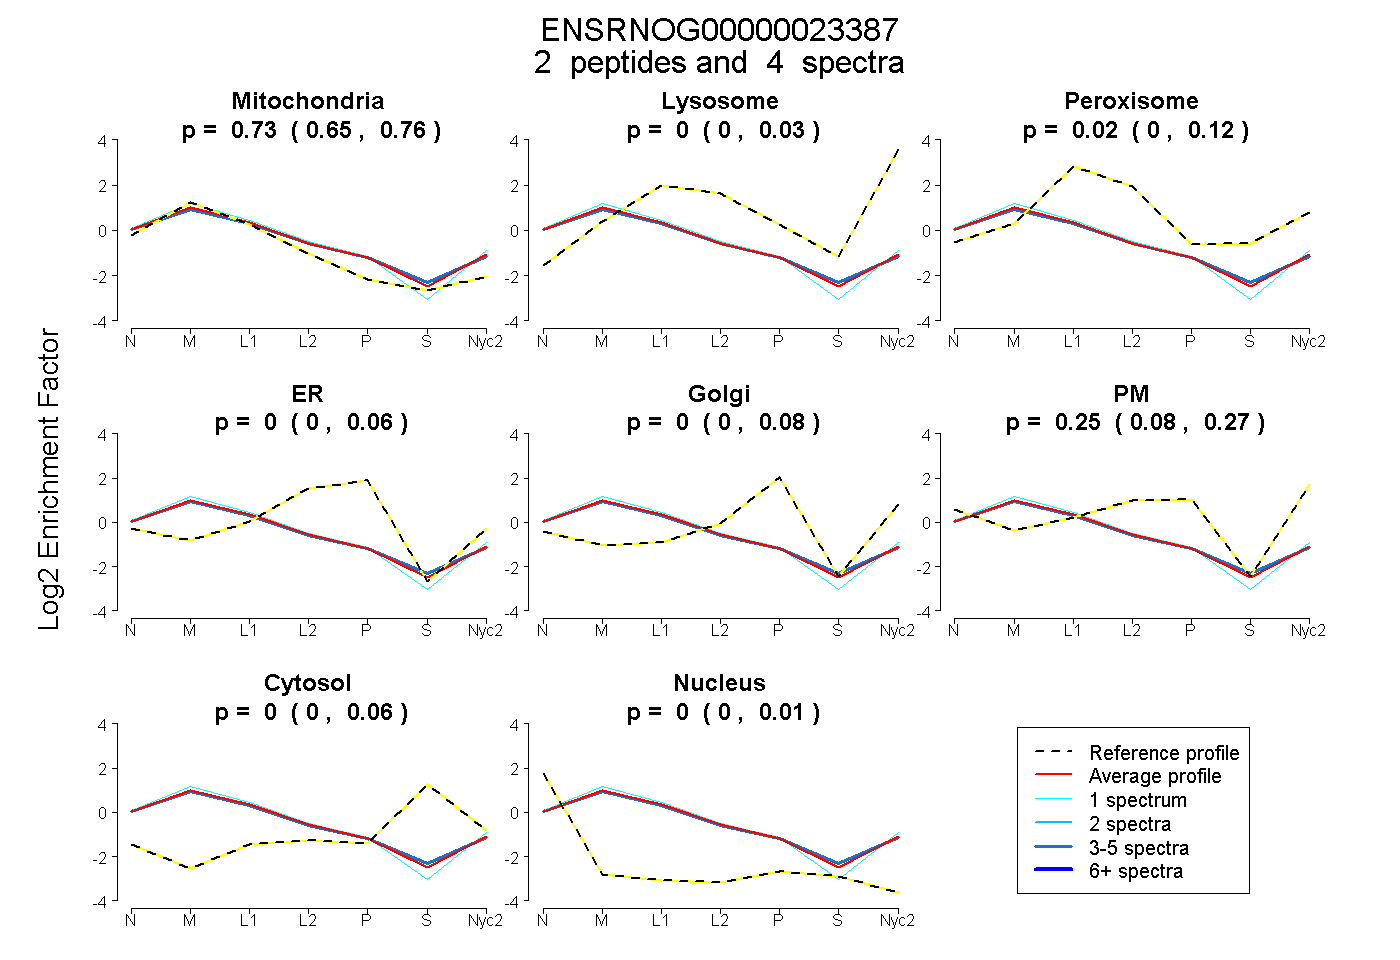
0.649 | 0.759
0.000 | 0.027
0.000 | 0.117
0.000 | 0.059
0.000 | 0.079
0.080 | 0.273
0.000 | 0.063
0.000 | 0.006
2peptides
spectra
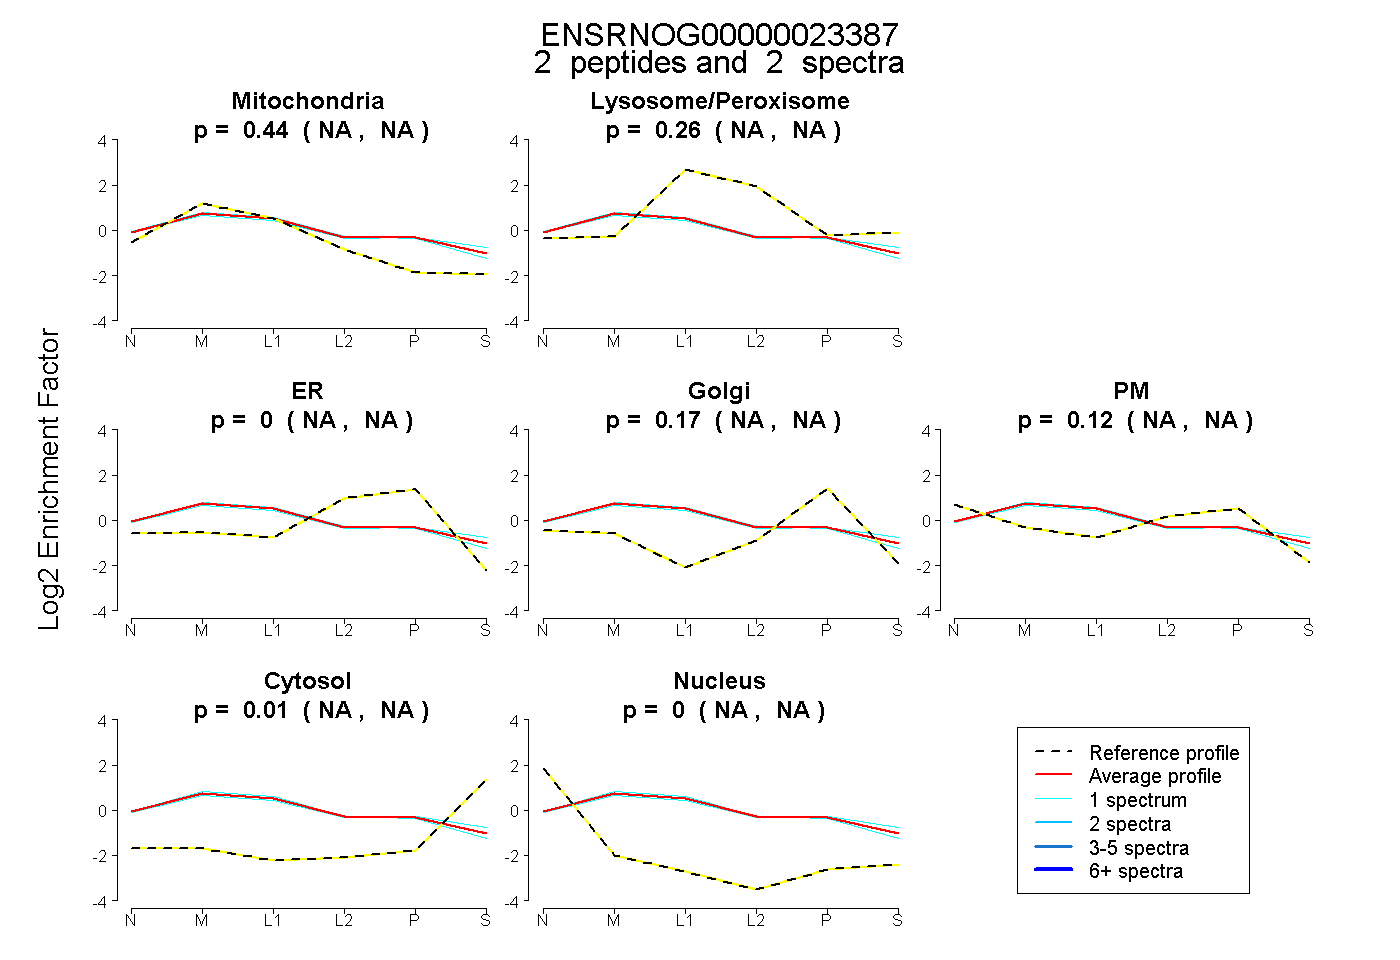
NA | NA
NA | NA
NA | NA
NA | NA
NA | NA
NA | NA
NA | NA
4peptides
spectra
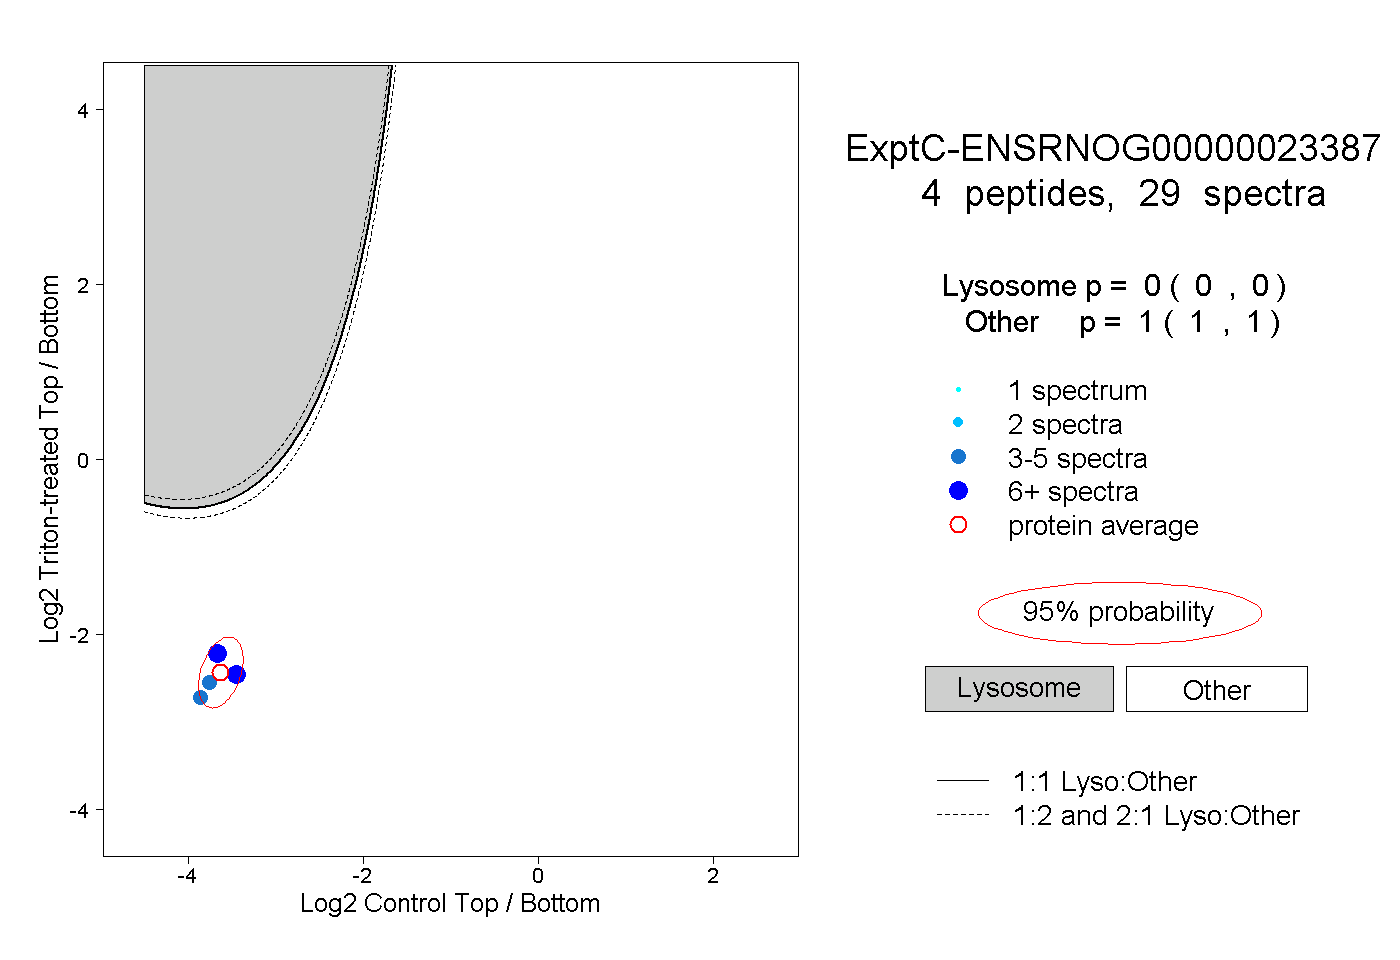
0.000 | 0.000
1.000 | 1.000