 2
2peptides
spectra
0.000 | 0.000
0.000 | 0.146
0.000 | 0.142
0.000 | 0.000
0.000 | 0.000
0.245 | 0.448
0.466 | 0.572
0.000 | 0.008
1peptide
spectrum
NA | NA
NA | NA
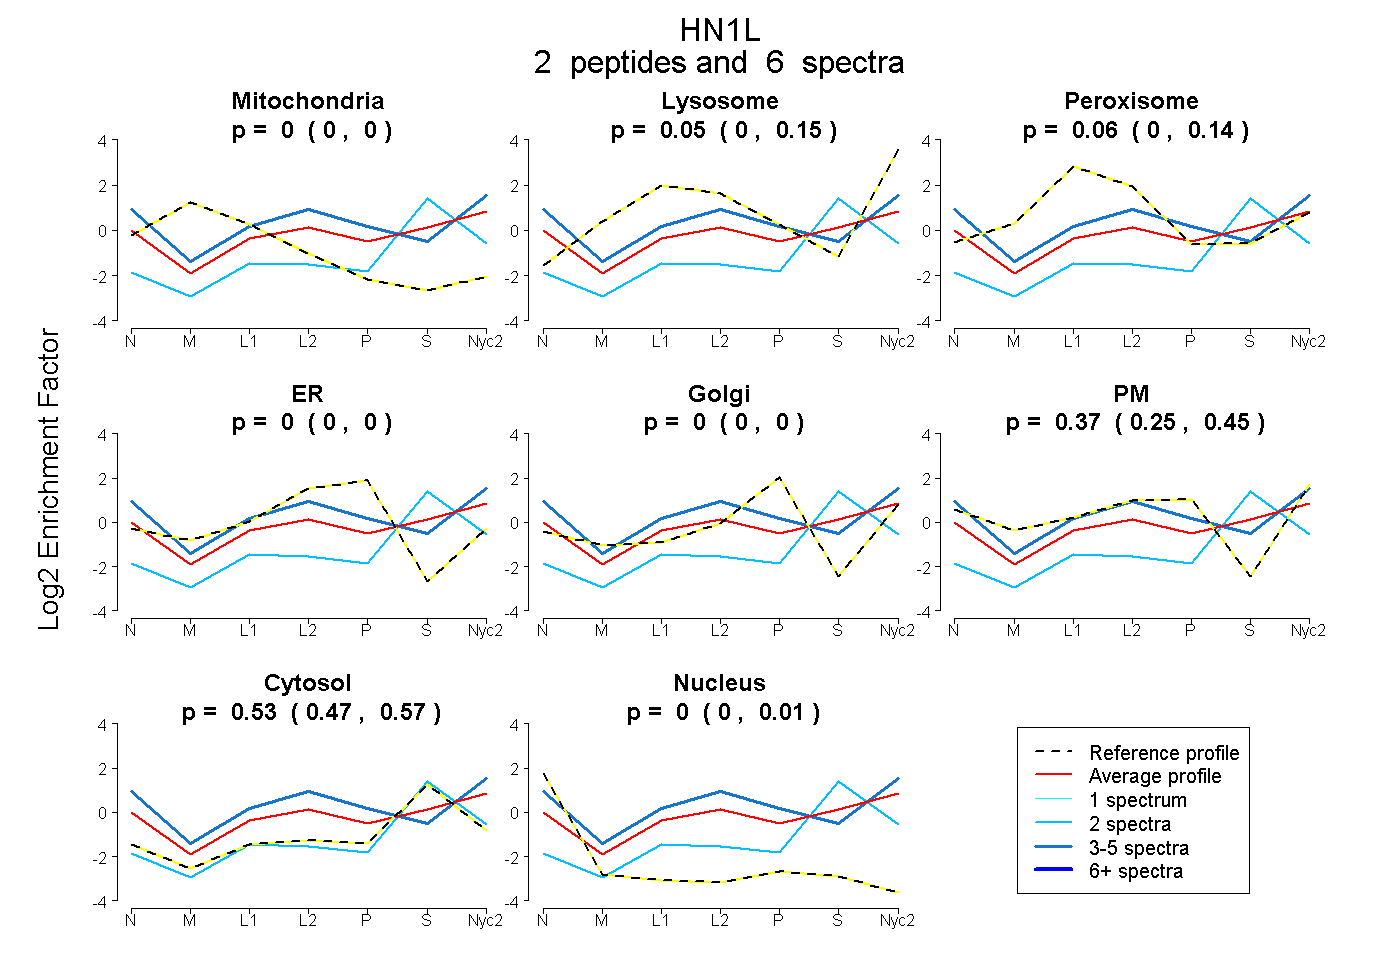
| Plot | Mito | Lyso | Perox | ER | Golgi | PM | Cytosol | Nucleus | |||||
| Expt A |
2 peptides |
6 spectra |
|
0.000 0.000 | 0.000 |
0.045 0.000 | 0.146 |
0.064 0.000 | 0.142 |
0.000 0.000 | 0.000 |
0.000 0.000 | 0.000 |
0.365 0.245 | 0.448 |
0.525 0.466 | 0.572 |
0.000 0.000 | 0.008 |
||
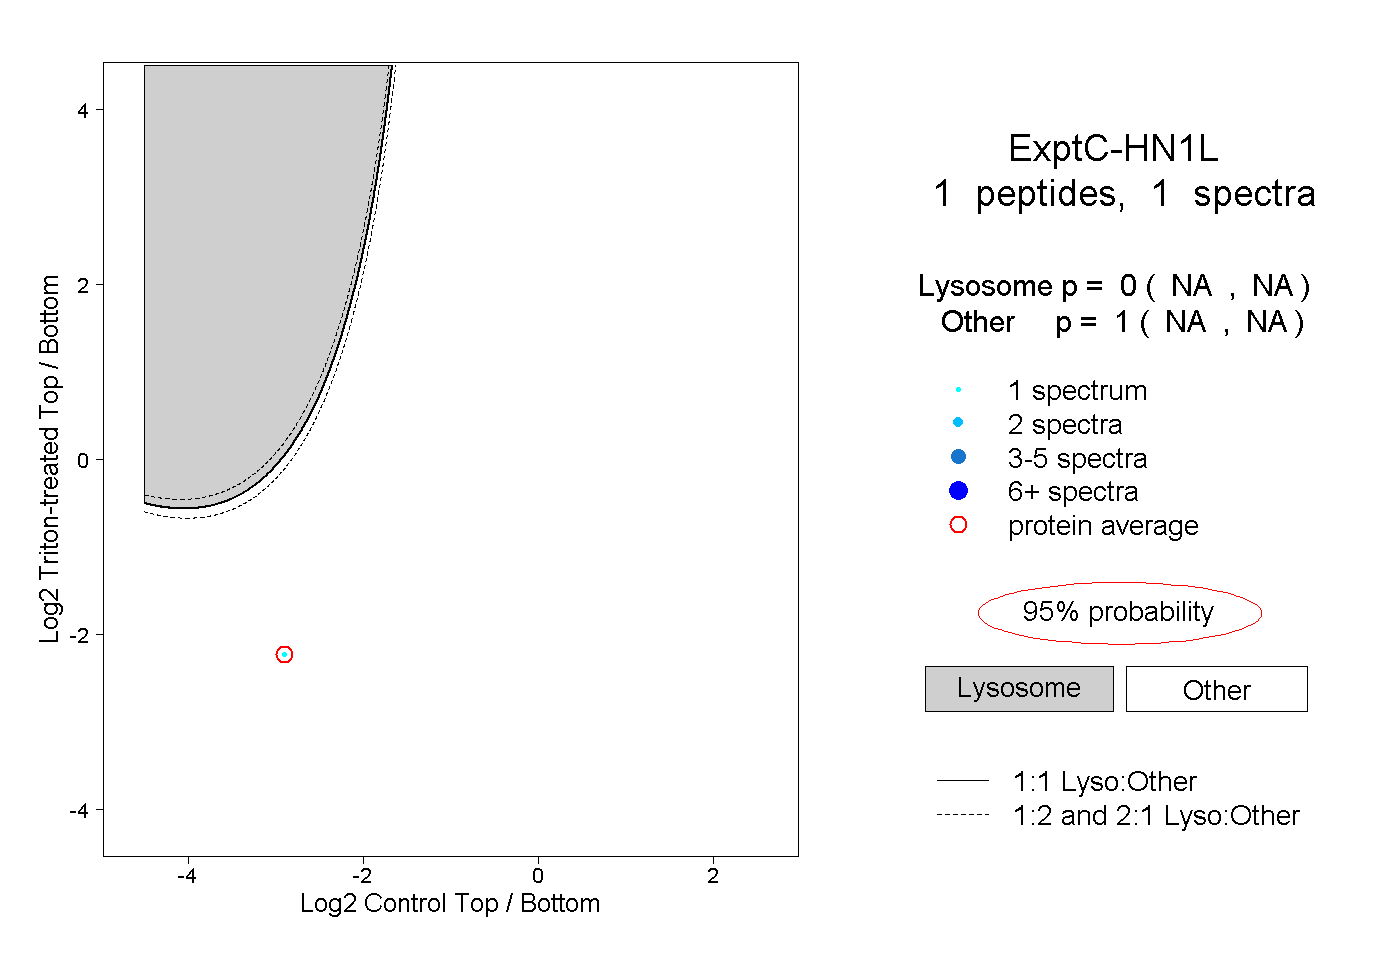
| Plot | Lyso | Other | |||||||||||
| Expt C |
1 peptide |
1 spectrum |
|
0.000 NA | NA |
1.000 NA | NA |