13
13peptides
spectra
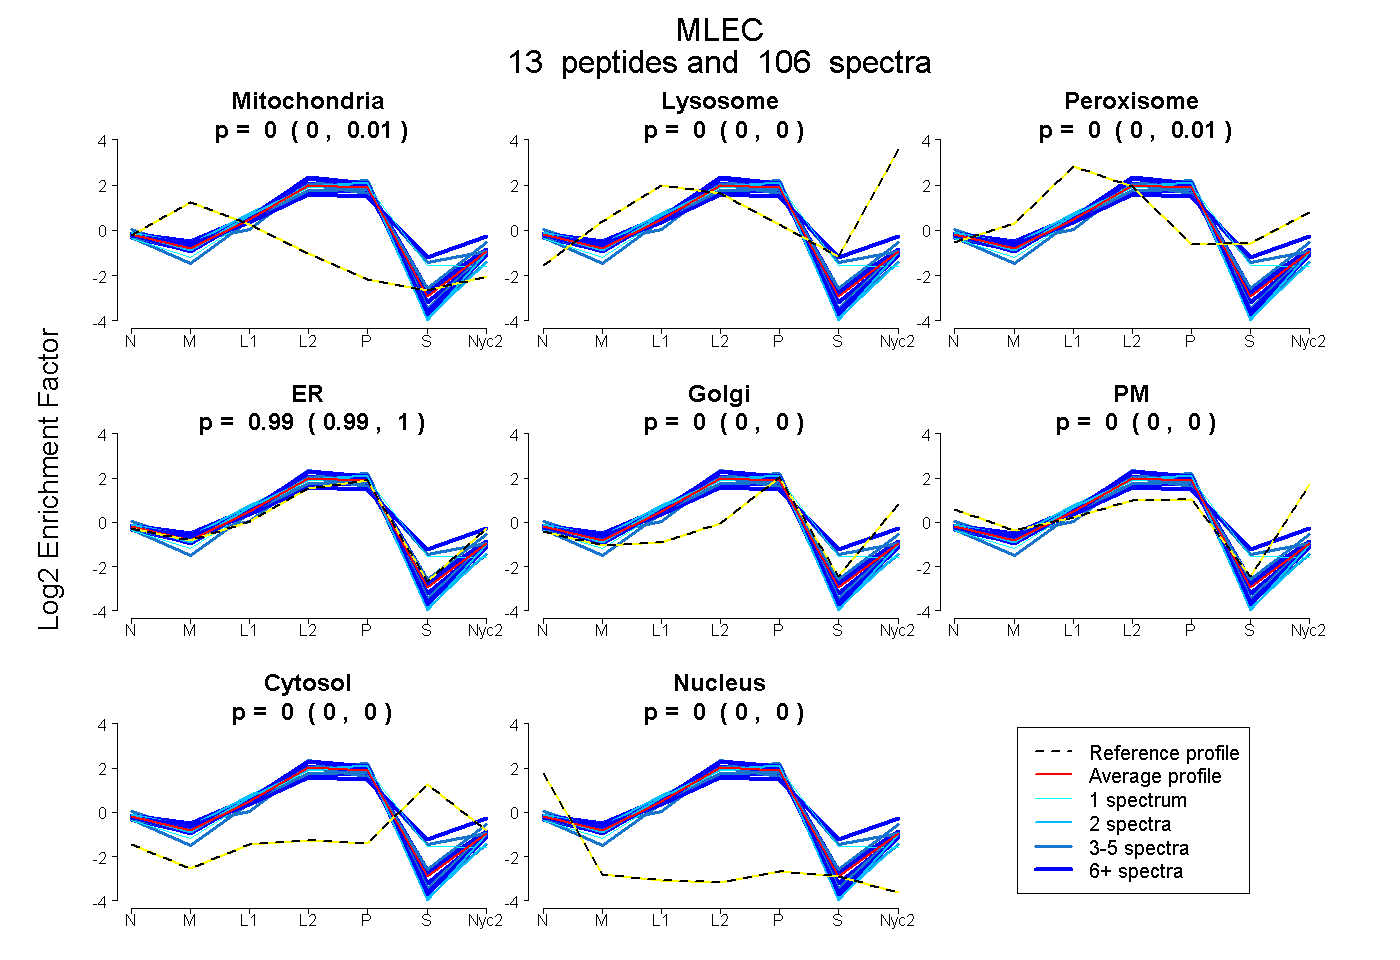
0.000 | 0.006
0.000 | 0.000
0.000 | 0.010
0.987 | 0.996
0.000 | 0.000
0.000 | 0.000
0.000 | 0.000
0.000 | 0.000
10peptides
spectra
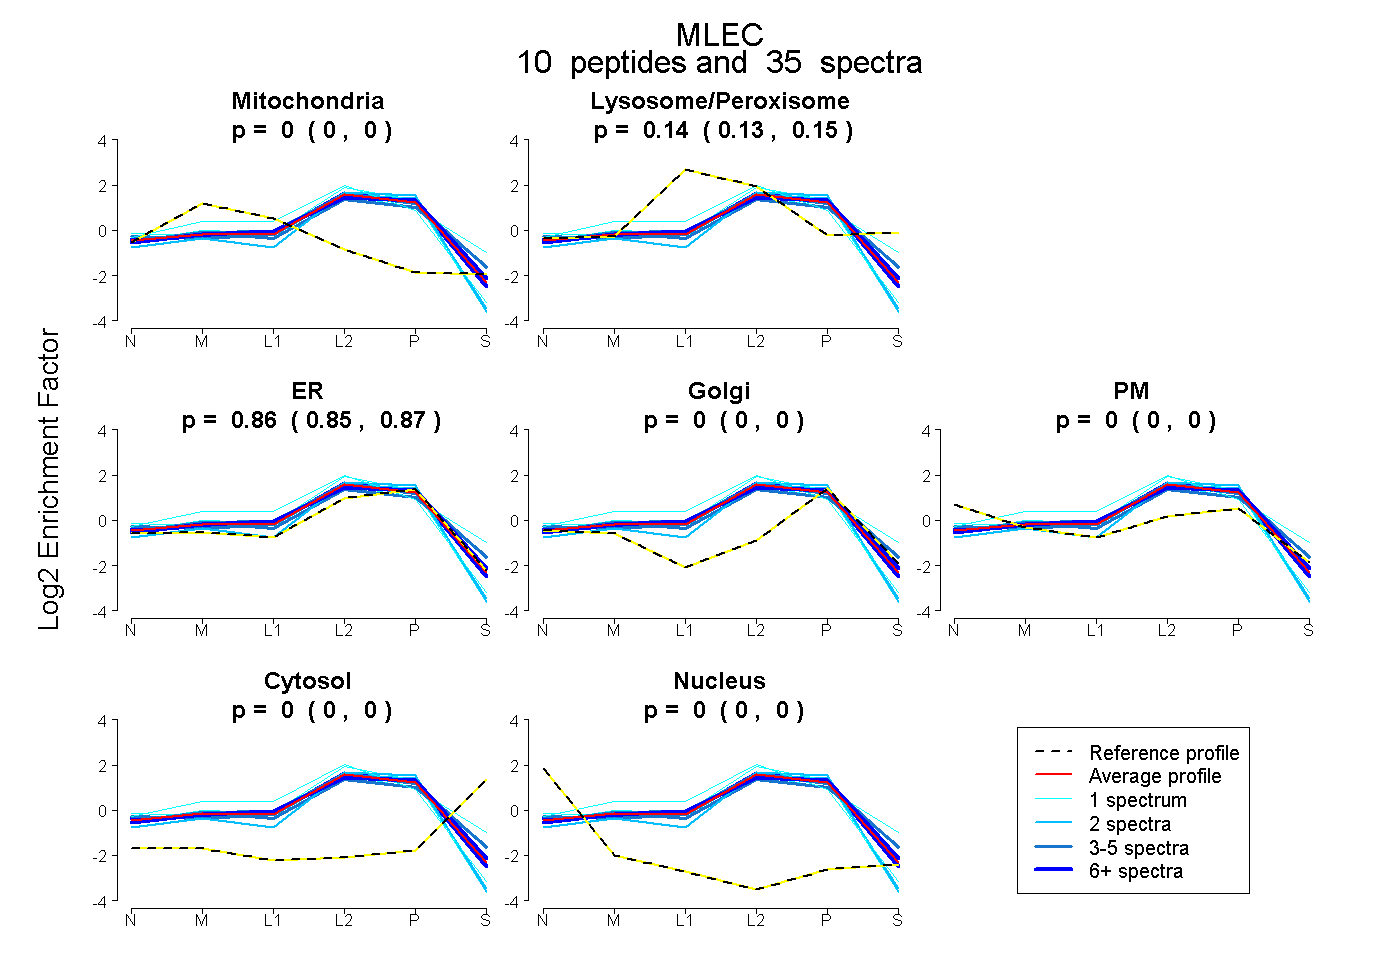
0.000 | 0.000
0.128 | 0.146
0.853 | 0.869
0.000 | 0.000
0.000 | 0.000
0.000 | 0.000
0.000 | 0.000
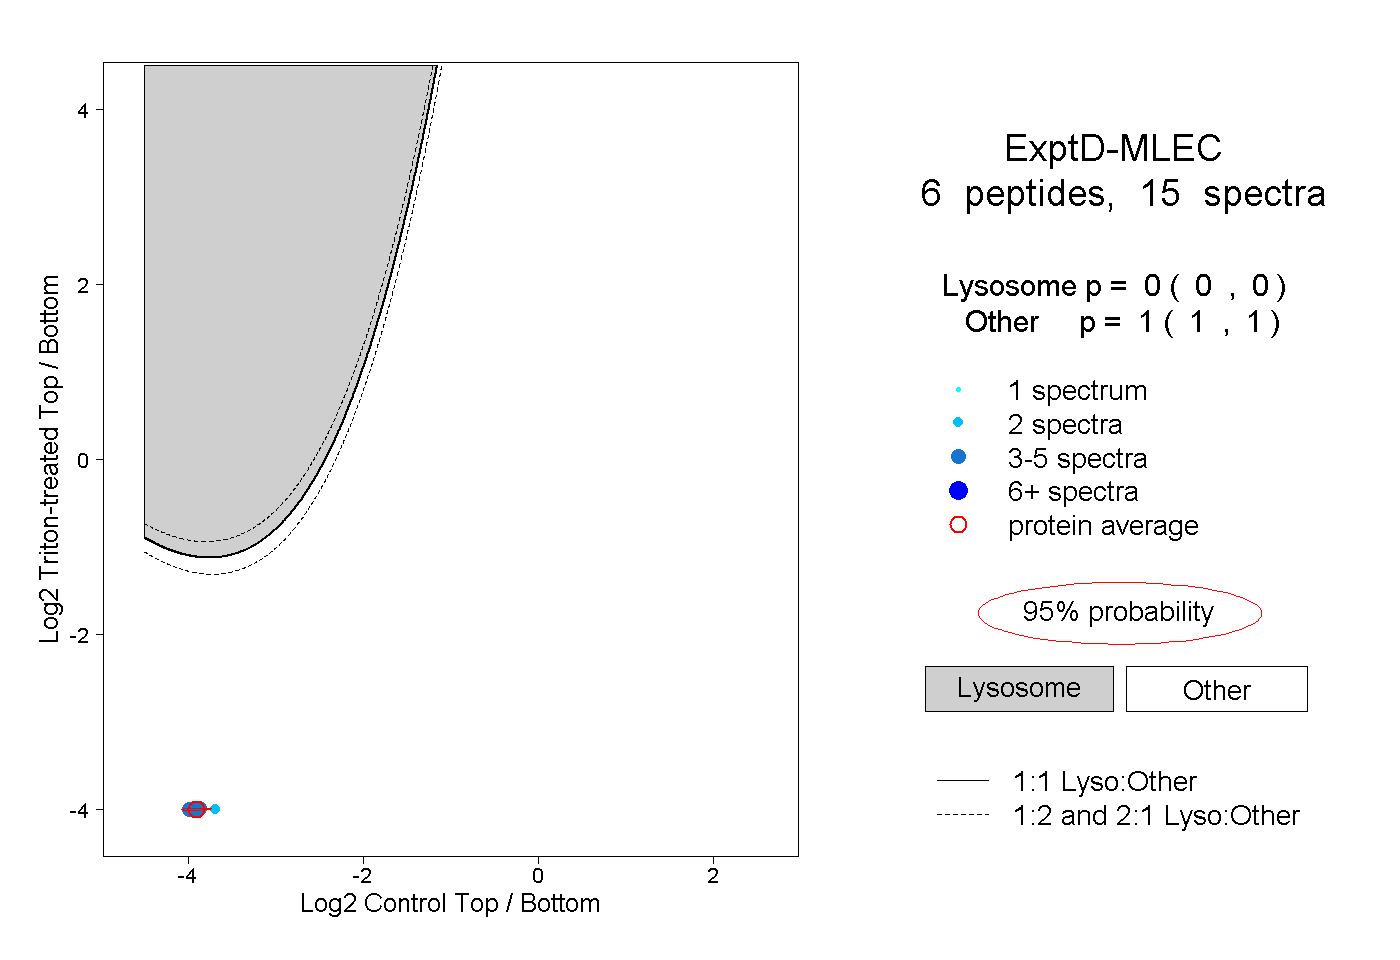
11peptides
spectra
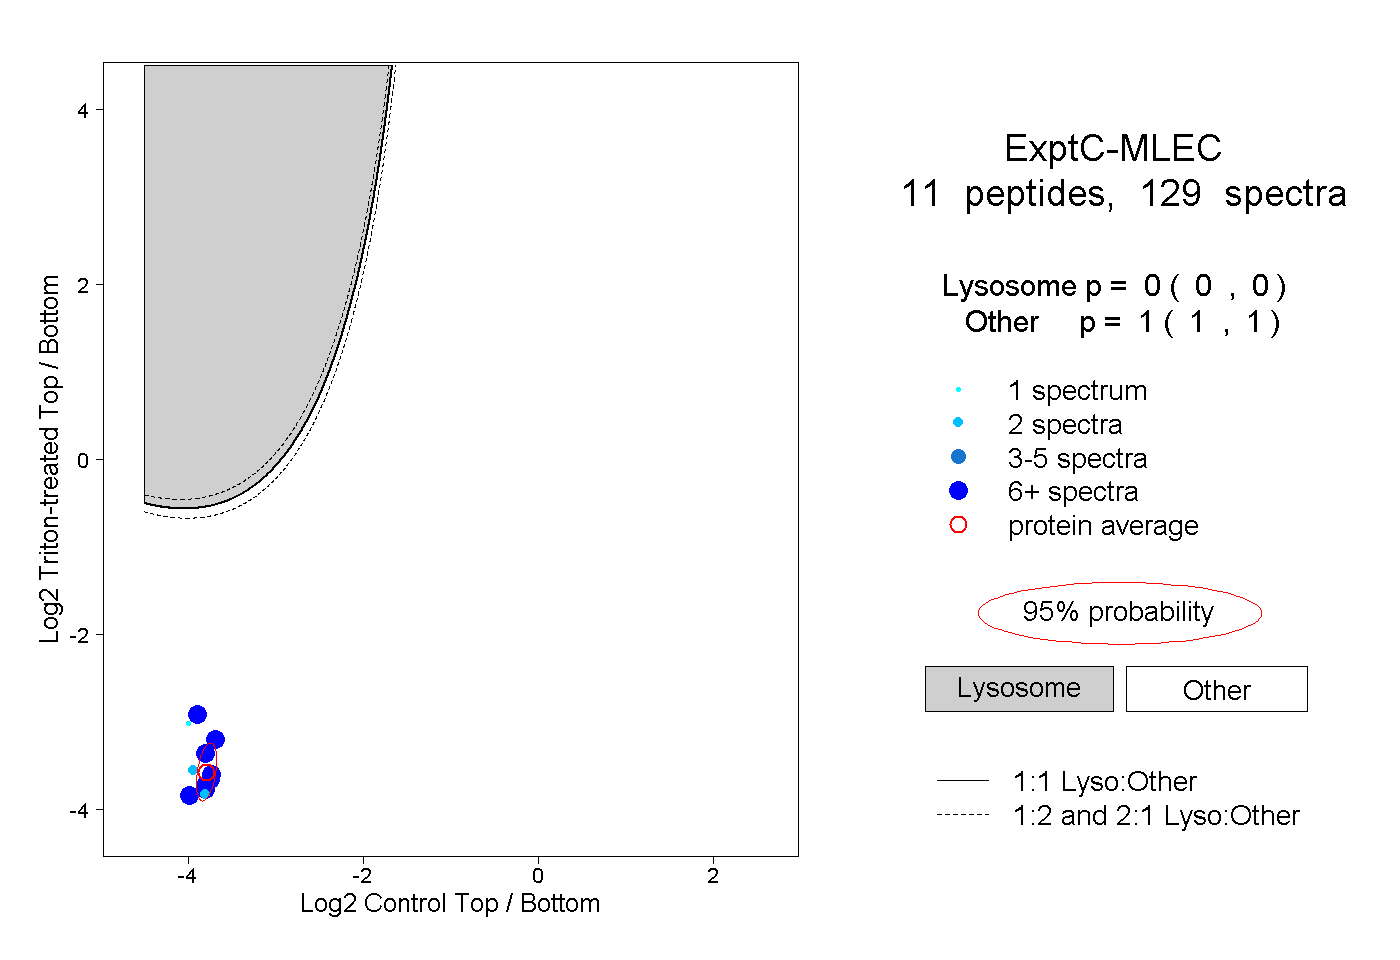
0.000 | 0.000
1.000 | 1.000