 5
5peptides
spectra
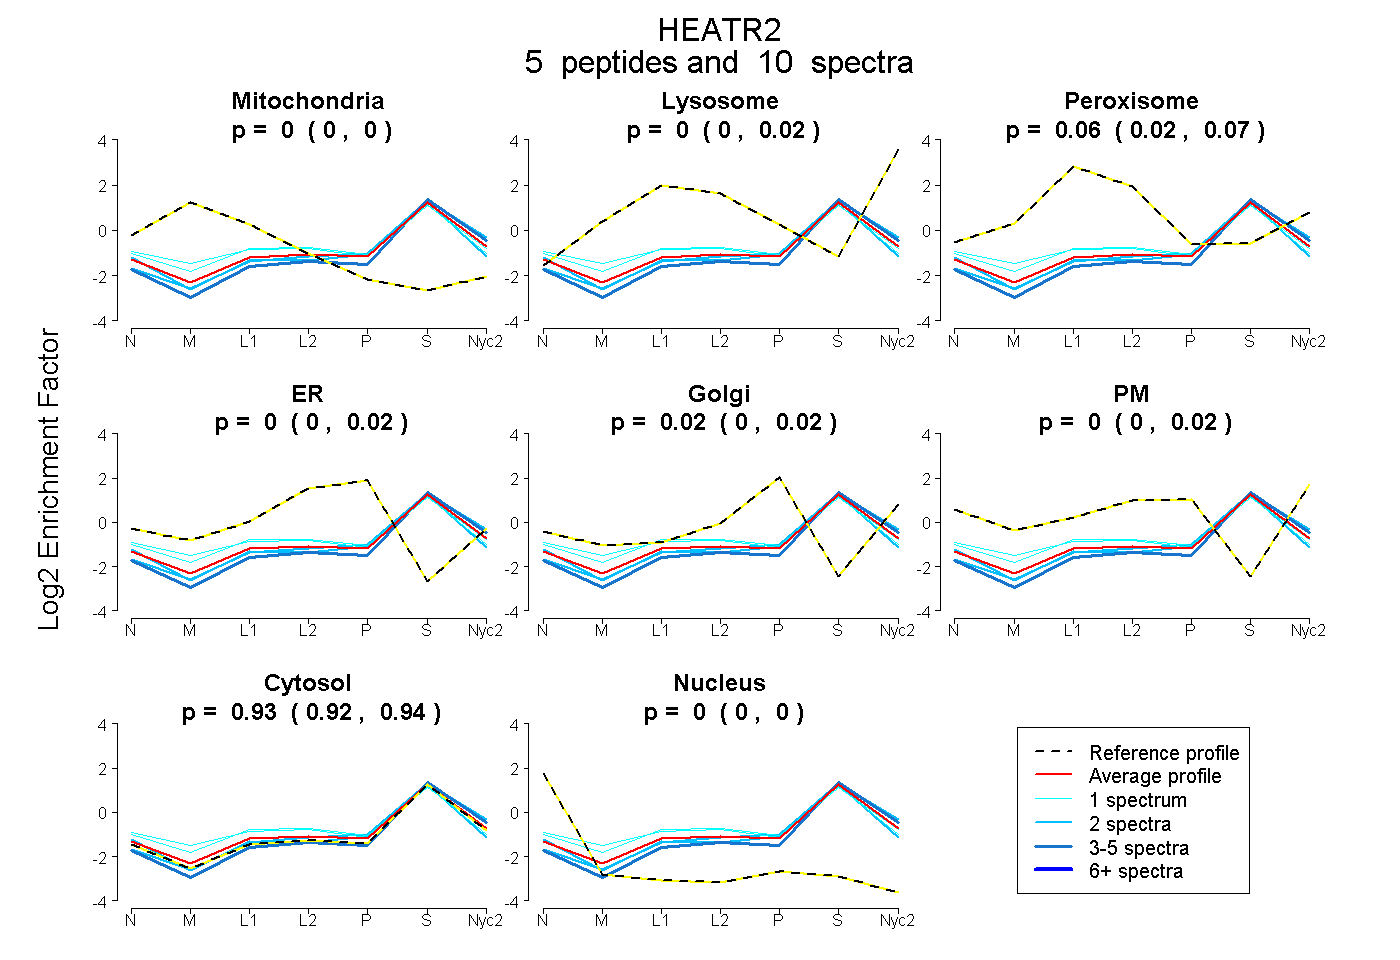
0.000 | 0.000
0.000 | 0.020
0.023 | 0.069
0.000 | 0.022
0.000 | 0.022
0.000 | 0.019
0.915 | 0.944
0.000 | 0.000
1peptide
spectra
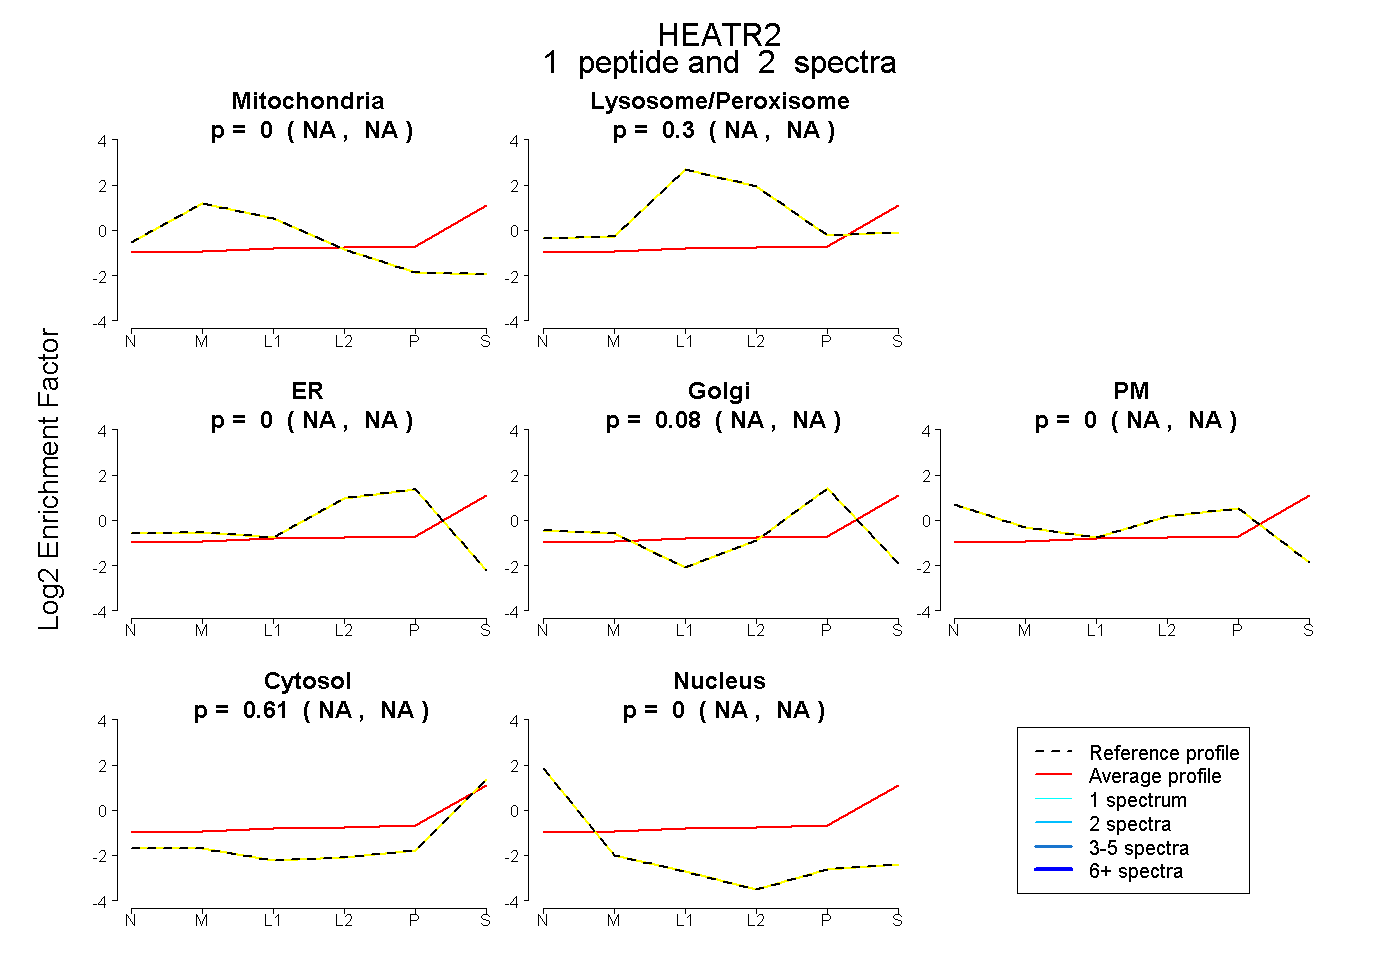
NA | NA
NA | NA
NA | NA
NA | NA
NA | NA
NA | NA
NA | NA
2peptides
spectra
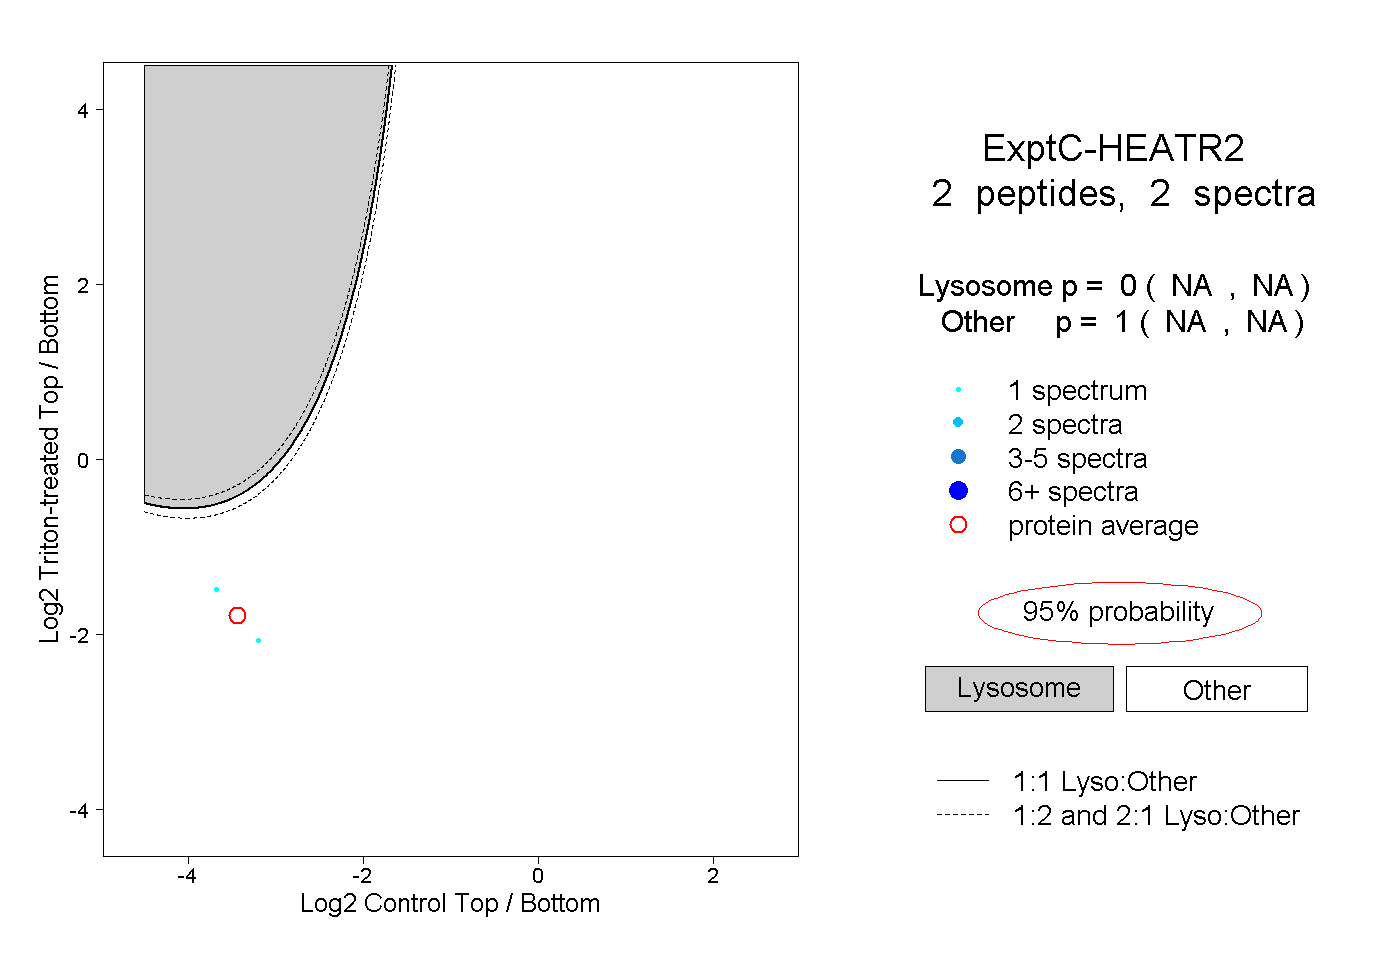
NA | NA
NA | NA