 4
4peptides
spectra

0.000 | 0.009
0.000 | 0.000
0.000 | 0.051
0.491 | 0.816
0.050 | 0.355
0.000 | 0.058
0.000 | 0.097
0.012 | 0.090
1peptide
spectra
NA | NA
NA | NA
| Plot | Mito | Lyso | Perox | ER | Golgi | PM | Cytosol | Nucleus | |||||
| Expt A |
4 peptides |
6 spectra |
|
0.000 0.000 | 0.009 |
0.000 0.000 | 0.000 |
0.022 0.000 | 0.051 |
0.665 0.491 | 0.816 |
0.229 0.050 | 0.355 |
0.000 0.000 | 0.058 |
0.020 0.000 | 0.097 |
0.064 0.012 | 0.090 |
||
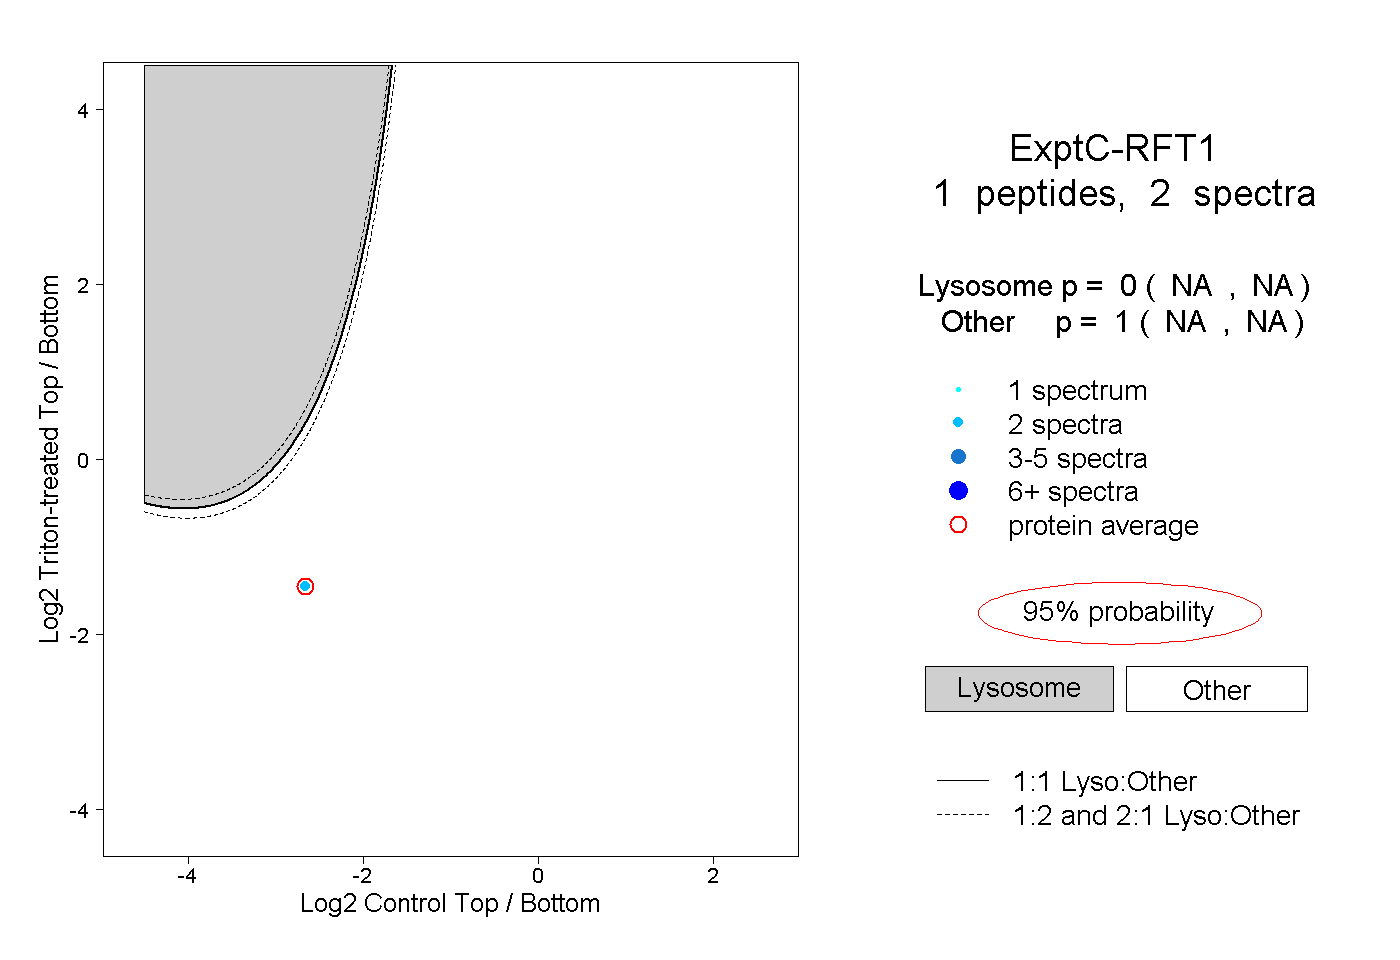
| Plot | Lyso | Other | |||||||||||
| Expt C |
1 peptide |
2 spectra |
|
0.000 NA | NA |
1.000 NA | NA |