 11
11peptides
spectra
0.000 | 0.000
0.000 | 0.000
0.000 | 0.000
0.000 | 0.000
0.000 | 0.000
0.000 | 0.000
0.948 | 0.952
0.048 | 0.052
| Plot | Mito | Lyso | Perox | ER | Golgi | PM | Cytosol | Nucleus | |||||
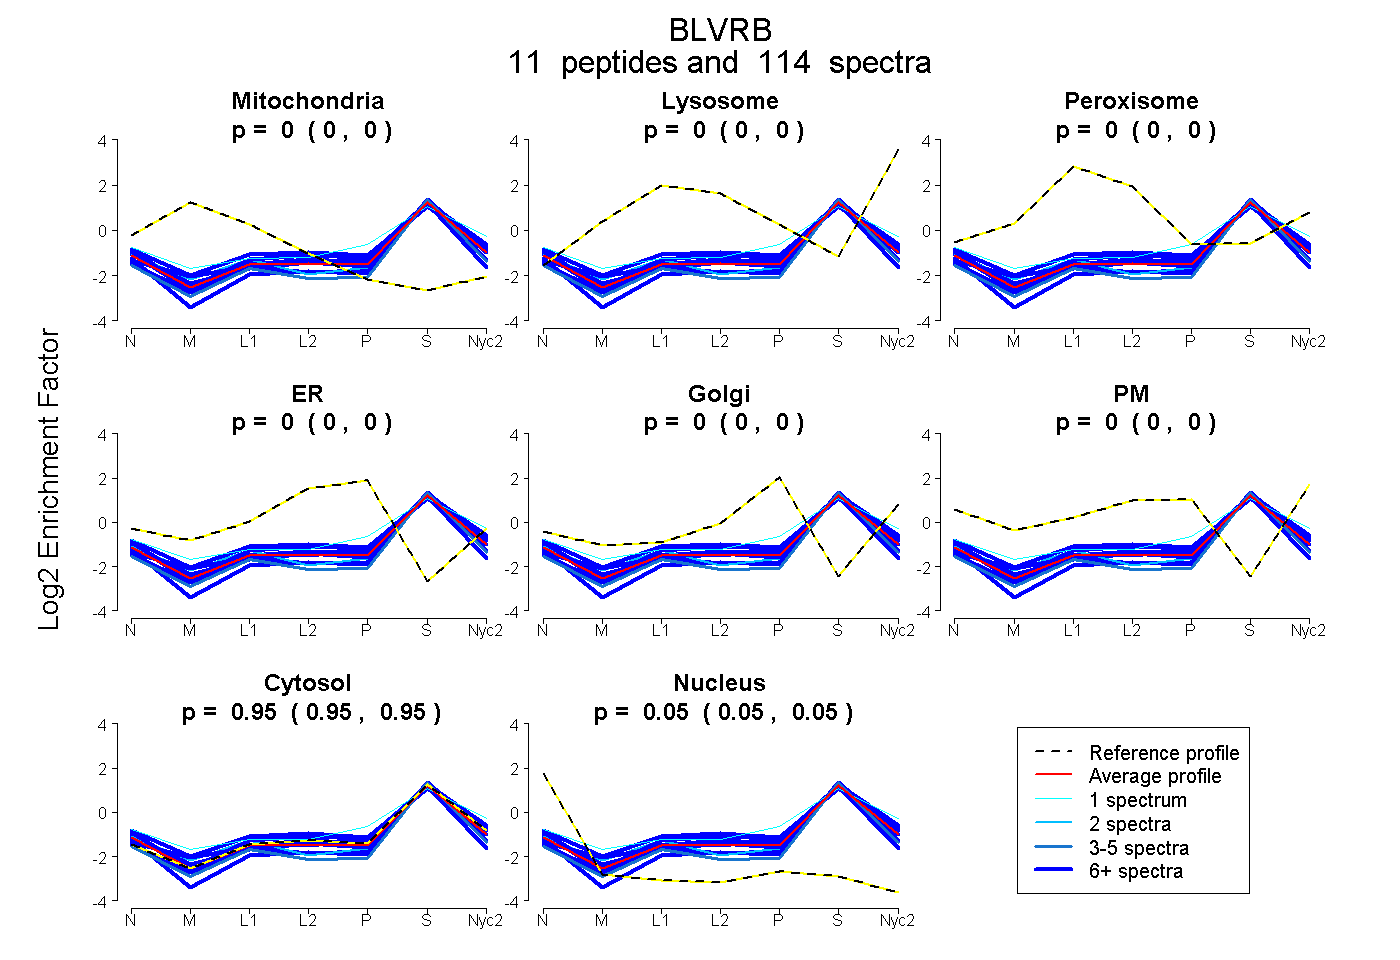
| Expt A |
11 peptides |
114 spectra |
|
0.000 0.000 | 0.000 |
0.000 0.000 | 0.000 |
0.000 0.000 | 0.000 |
0.000 0.000 | 0.000 |
0.000 0.000 | 0.000 |
0.000 0.000 | 0.000 |
0.950 0.948 | 0.952 |
0.050 0.048 | 0.052 |
| 1 spectrum, VVACTSAFLLWDPSK | 0.000 | 0.000 | 0.000 | 0.000 | 0.019 | 0.161 | 0.820 | 0.000 | ||
| 13 spectra, CLTTHEYDGQK | 0.007 | 0.000 | 0.000 | 0.000 | 0.000 | 0.000 | 0.897 | 0.096 | ||
| 18 spectra, TYPSHQYD | 0.000 | 0.000 | 0.094 | 0.000 | 0.000 | 0.042 | 0.830 | 0.034 | ||
| 11 spectra, IAIFGATGR | 0.000 | 0.000 | 0.000 | 0.000 | 0.000 | 0.000 | 0.922 | 0.078 | ||
| 5 spectra, YVAVMPPHIGDQPLTGAYTVTLDGR | 0.000 | 0.000 | 0.000 | 0.000 | 0.000 | 0.000 | 0.918 | 0.082 | ||
| 11 spectra, ILEESGLK | 0.002 | 0.000 | 0.000 | 0.000 | 0.000 | 0.000 | 0.940 | 0.058 | ||
| 7 spectra, AHGVDK | 0.000 | 0.000 | 0.000 | 0.000 | 0.009 | 0.005 | 0.946 | 0.040 | ||
| 7 spectra, NIVAAMK | 0.039 | 0.010 | 0.000 | 0.000 | 0.000 | 0.000 | 0.951 | 0.000 | ||
| 2 spectra, LPSEGPQPAHVVVGDVLQAGDVDK | 0.045 | 0.000 | 0.000 | 0.000 | 0.000 | 0.000 | 0.923 | 0.033 | ||
| 19 spectra, LQDVTDDHIR | 0.000 | 0.000 | 0.000 | 0.000 | 0.000 | 0.069 | 0.922 | 0.009 | ||
| 20 spectra, HDLGHFMLR | 0.000 | 0.000 | 0.000 | 0.000 | 0.000 | 0.000 | 0.934 | 0.066 |
| Plot | Mito | Lyso or Perox | ER | Golgi | PM | Cytosol | Nucleus | ||||||
| Expt B |
7 peptides |
45 spectra |
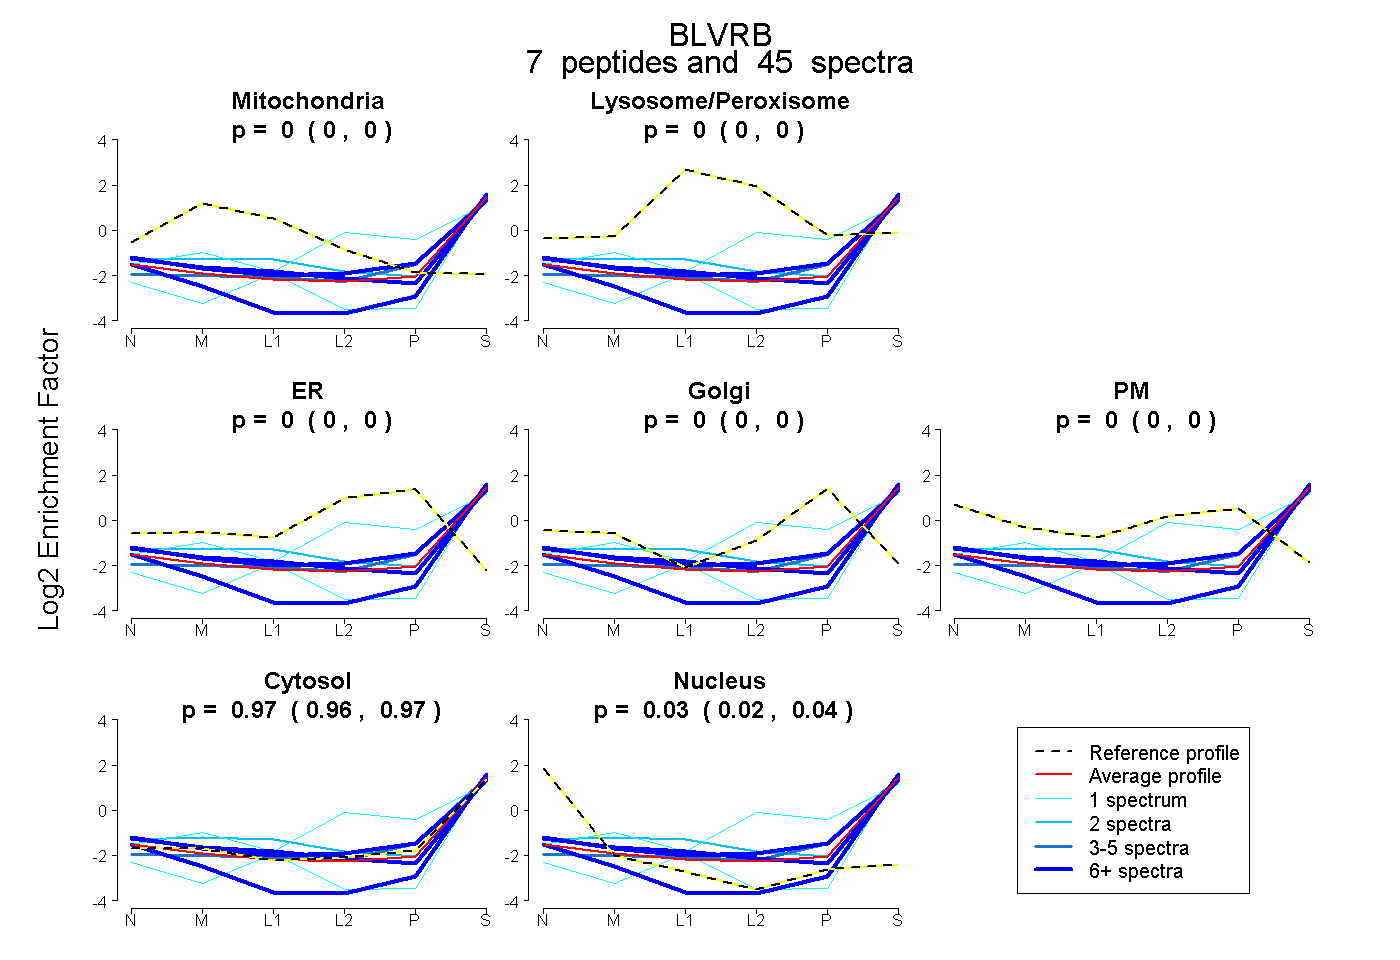 |
0.000 0.000 | 0.000 |
0.000 0.000 | 0.000 |
0.000 0.000 | 0.000 |
0.000 0.000 | 0.000 |
0.000 0.000 | 0.000 |
0.968 0.960 | 0.974 |
0.032 0.024 | 0.038 |
|||
| Plot | Lyso | Other | |||||||||||
| Expt C |
10 peptides |
110 spectra |
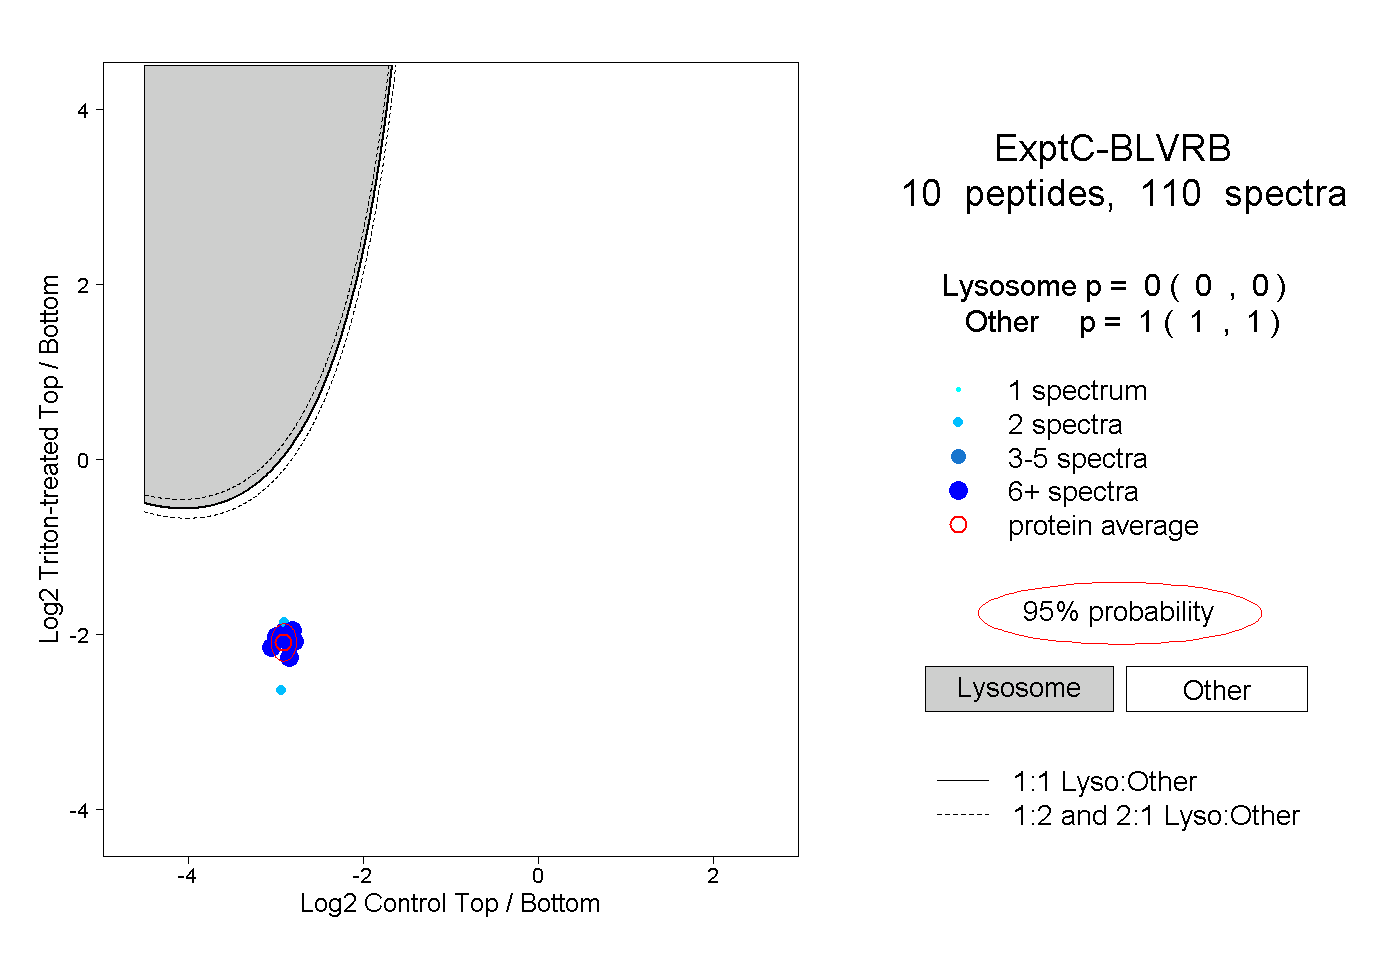 |
0.000 0.000 | 0.000 |
1.000 1.000 | 1.000 |
||||||||
| Plot | Lyso | Other | |||||||||||
| Expt D |
6 peptides |
13 spectra |
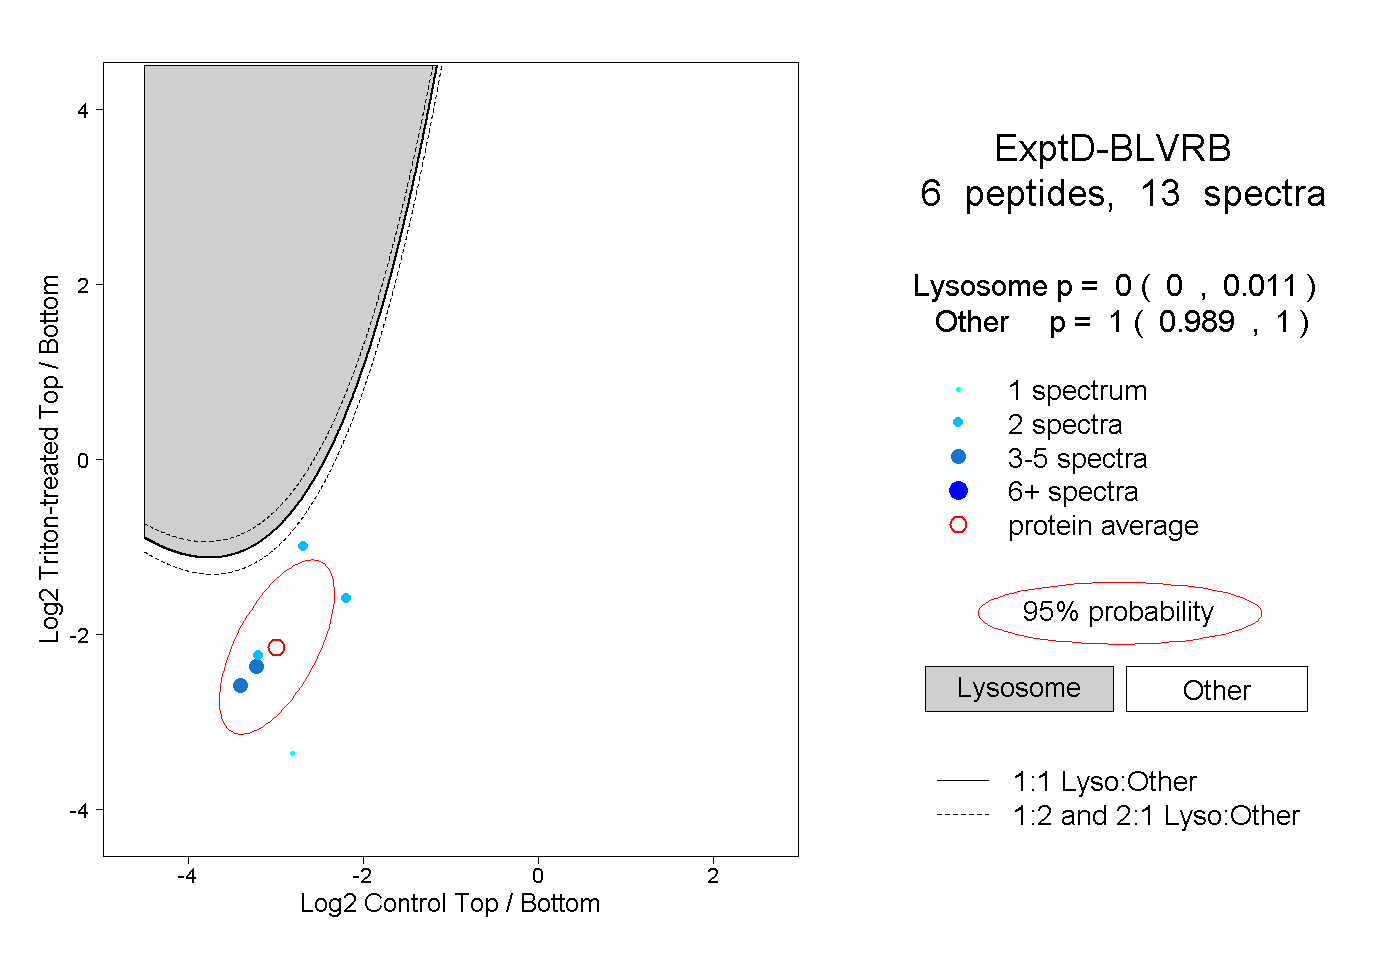 |
0.000 0.000 | 0.011 |
1.000 0.989 | 1.000 |