 16
16peptides
spectra
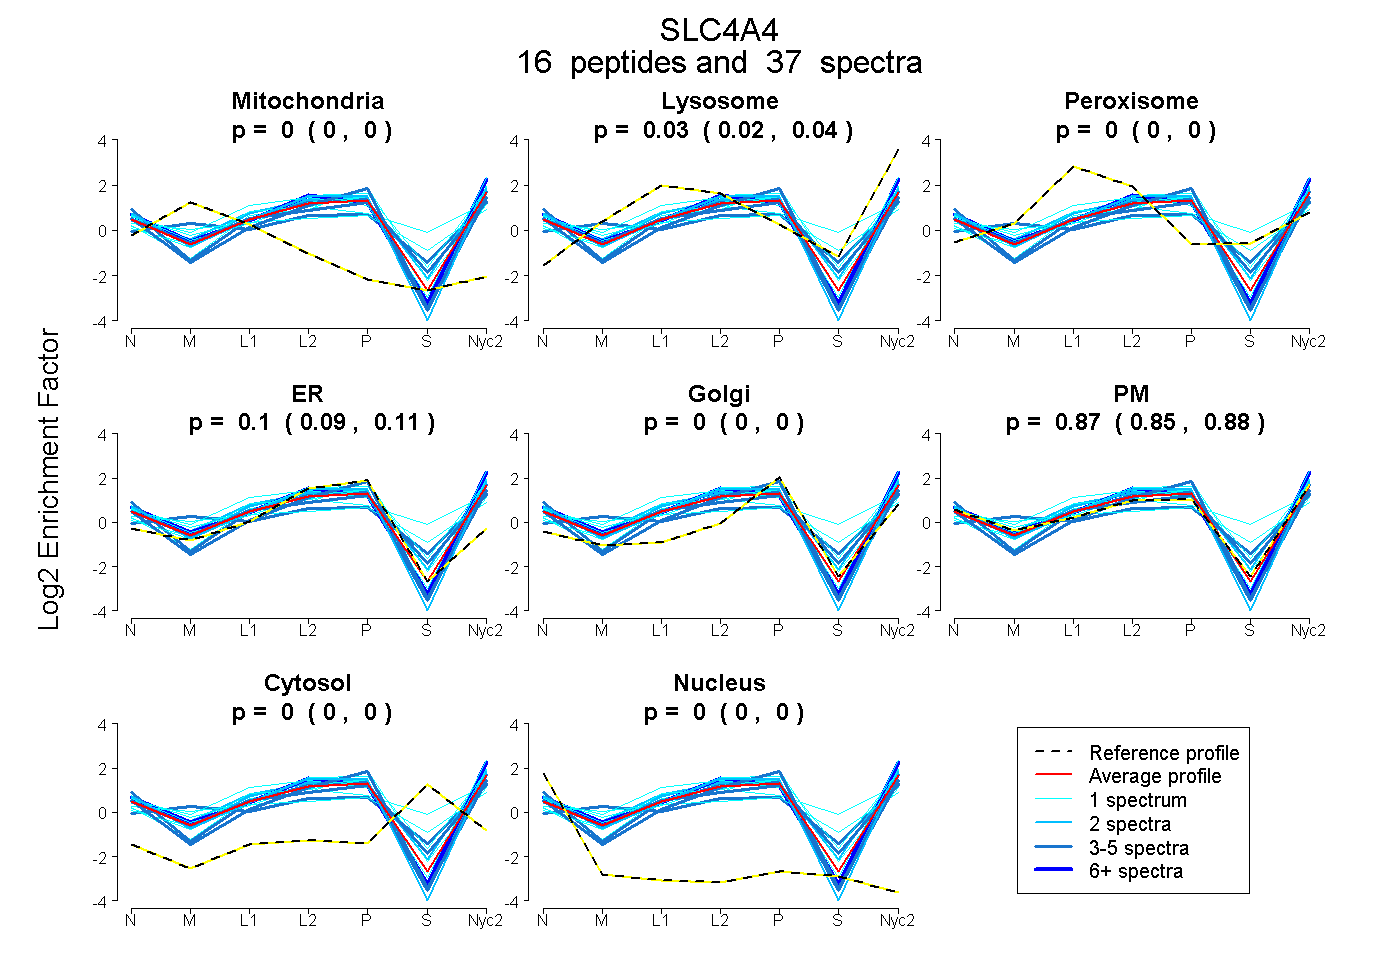
0.000 | 0.000
0.021 | 0.040
0.000 | 0.000
0.091 | 0.115
0.000 | 0.000
0.847 | 0.881
0.000 | 0.000
0.000 | 0.000
2peptides
spectra
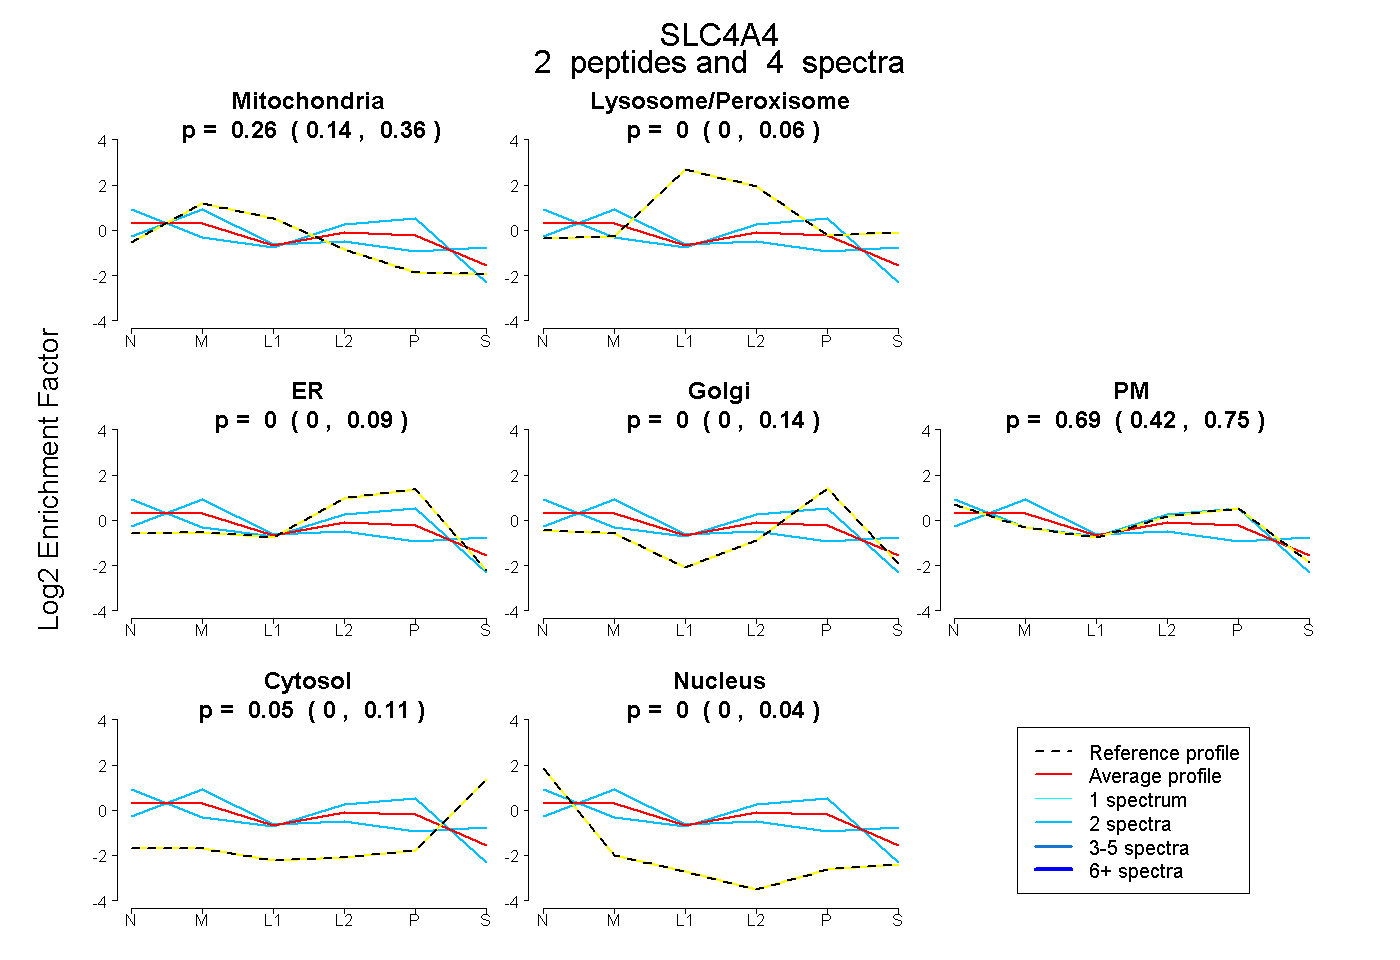
0.138 | 0.356
0.000 | 0.062
0.000 | 0.086
0.000 | 0.136
0.423 | 0.745
0.000 | 0.108
0.000 | 0.036
15peptides
spectra
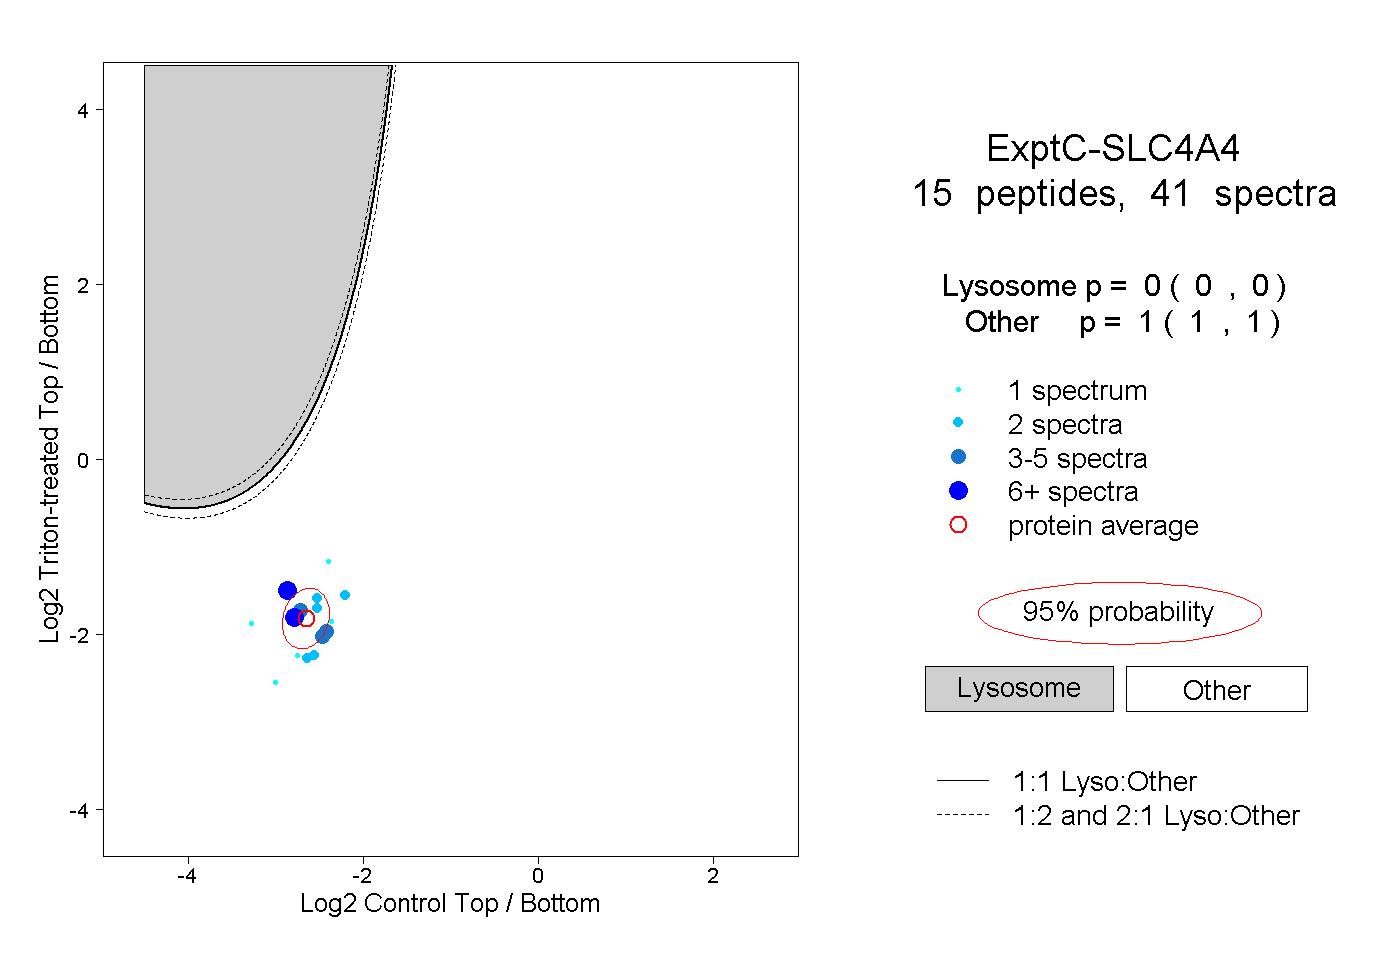
0.000 | 0.000
1.000 | 1.000
1peptide
spectrum
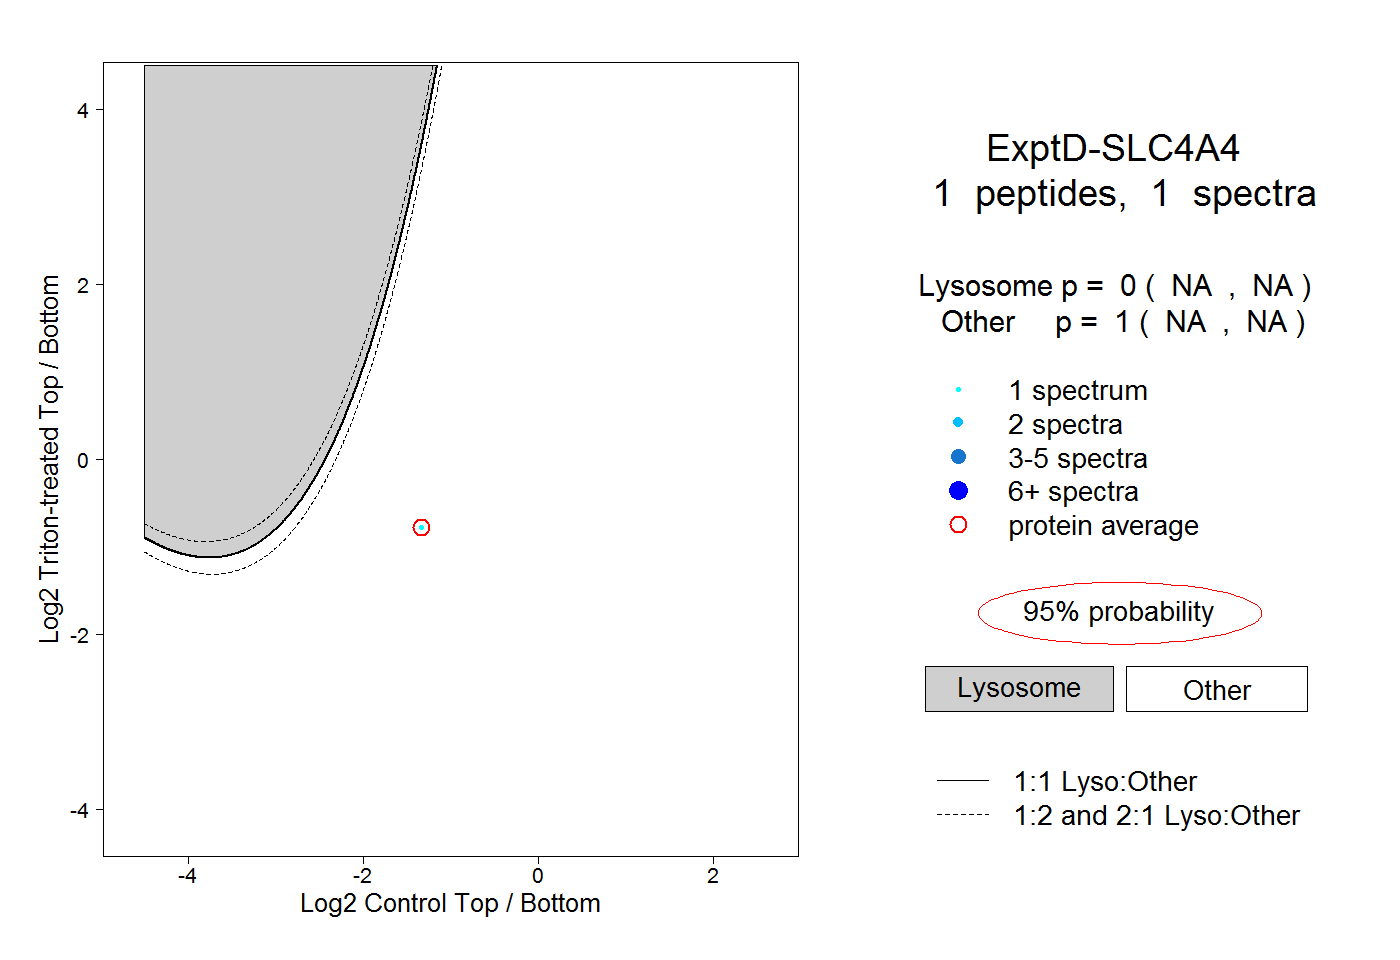
NA | NA
NA | NA