 13
13peptides
spectra
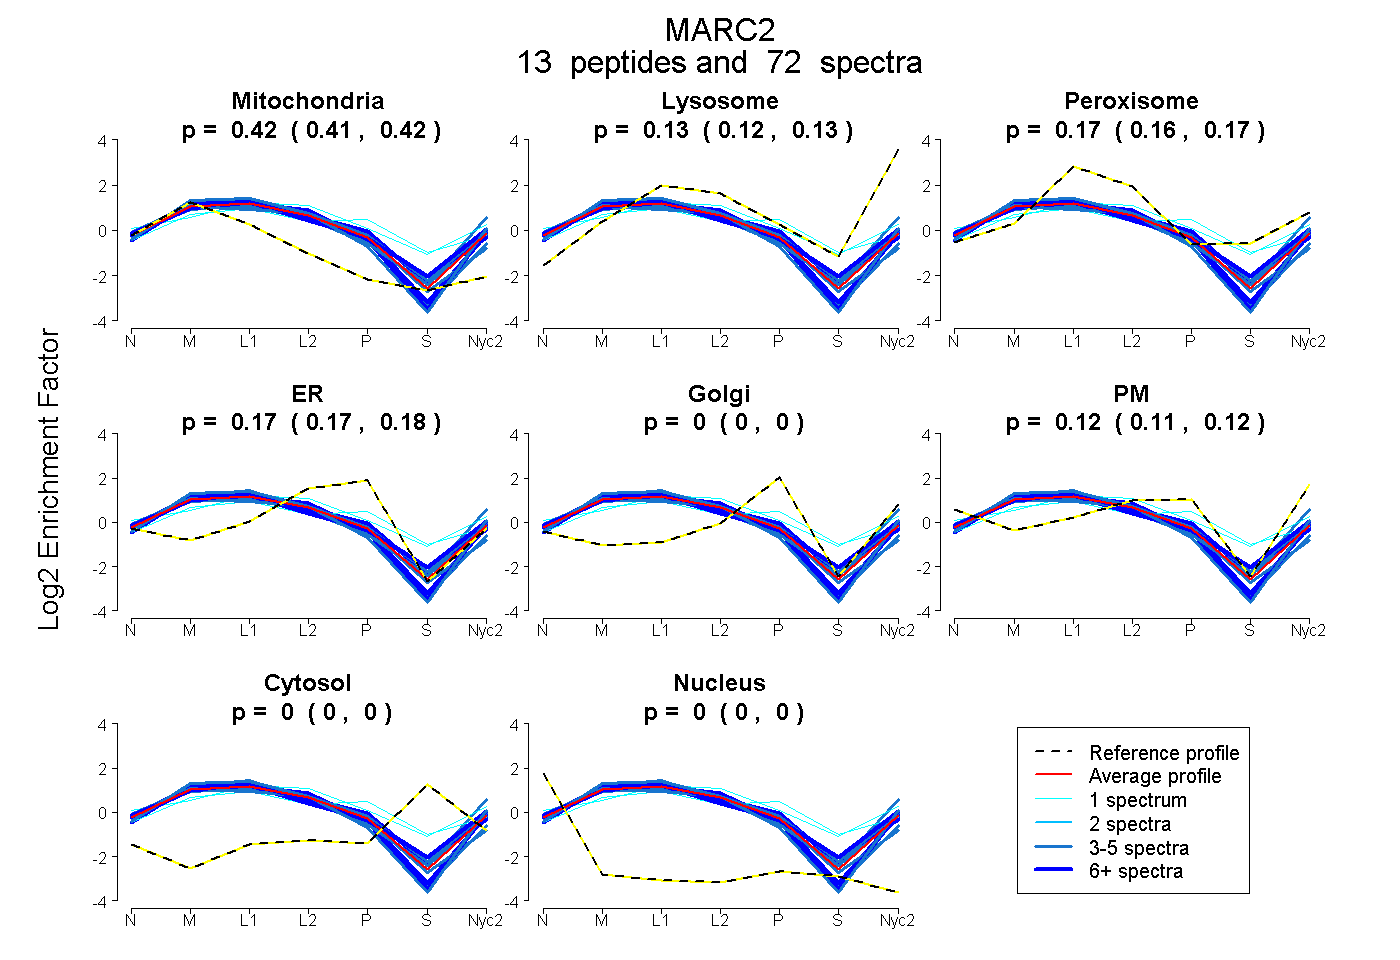
0.414 | 0.420
0.121 | 0.131
0.158 | 0.173
0.166 | 0.179
0.000 | 0.000
0.110 | 0.124
0.000 | 0.000
0.000 | 0.000
14peptides
spectra

0.581 | 0.593
0.174 | 0.192
0.220 | 0.237
0.000 | 0.000
0.000 | 0.000
0.000 | 0.000
0.000 | 0.000
17peptides
spectra
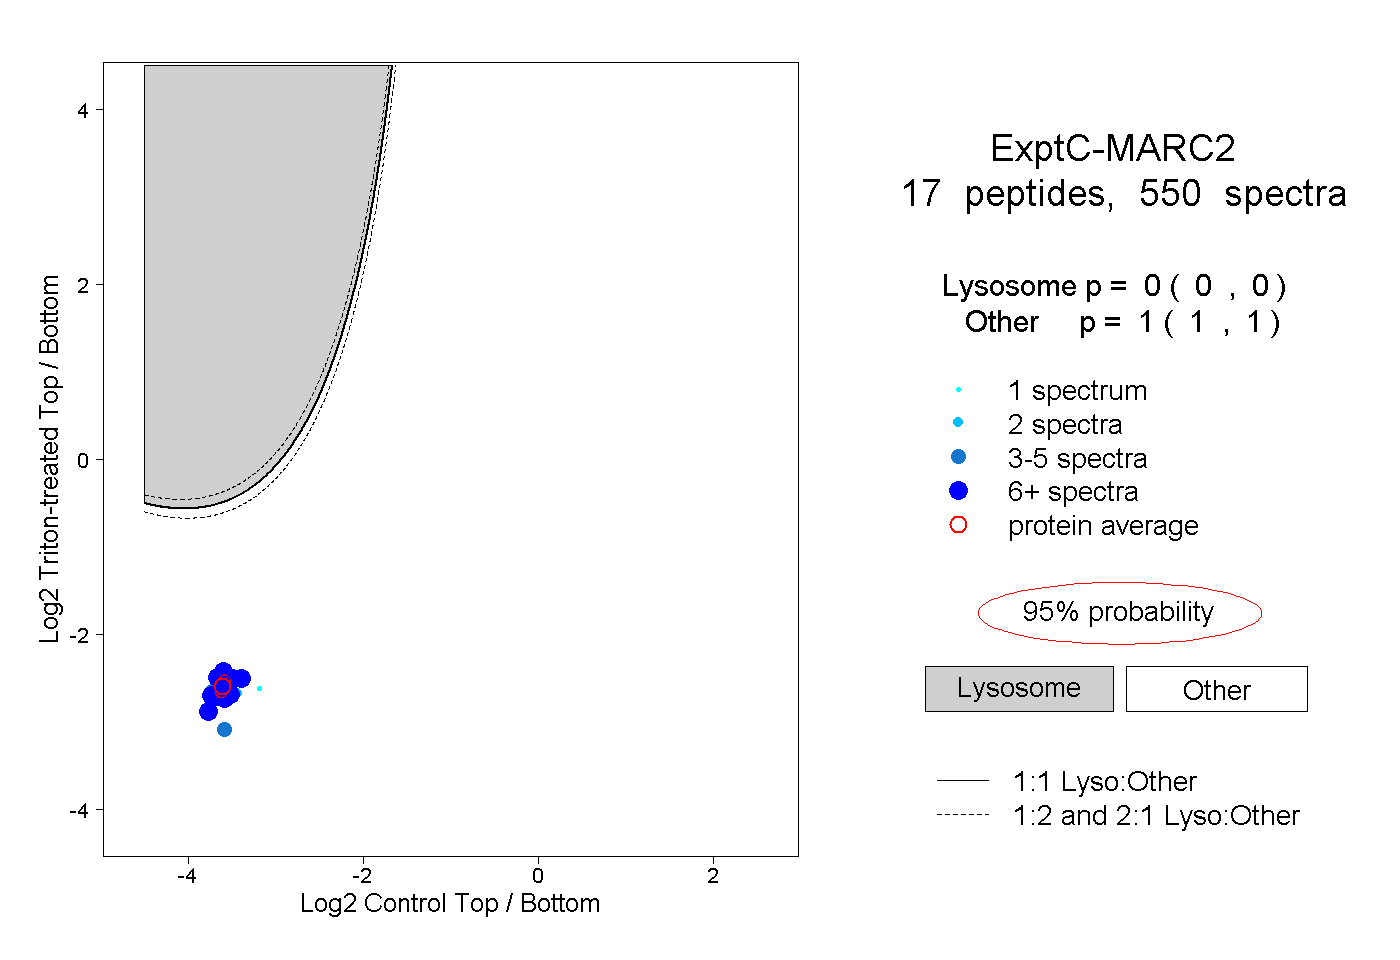
0.000 | 0.000
1.000 | 1.000
15peptides
spectra
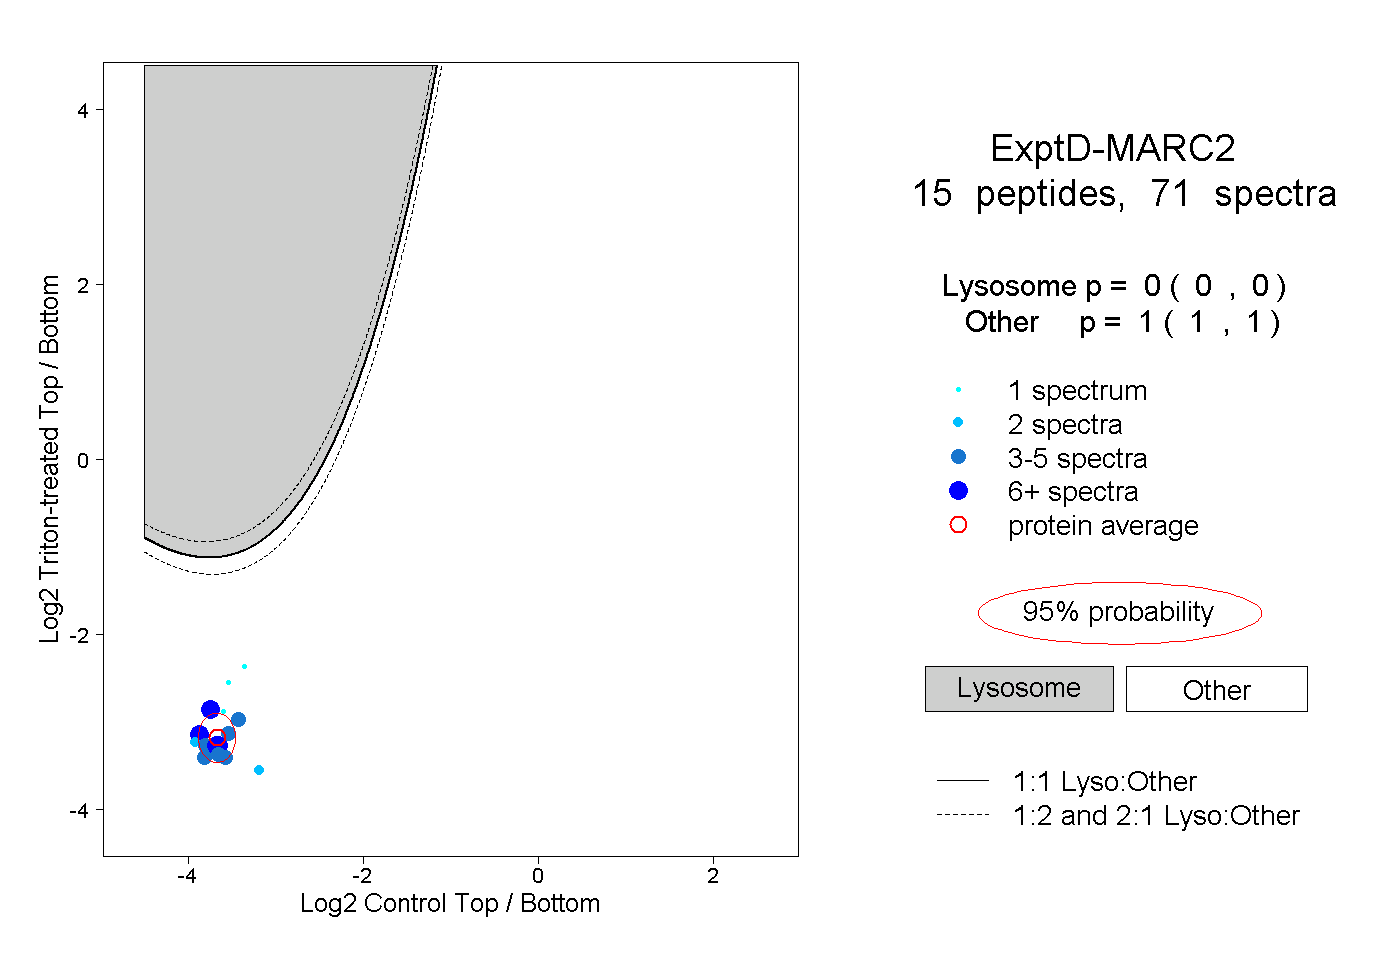
0.000 | 0.000
1.000 | 1.000