 1
1peptide
spectra
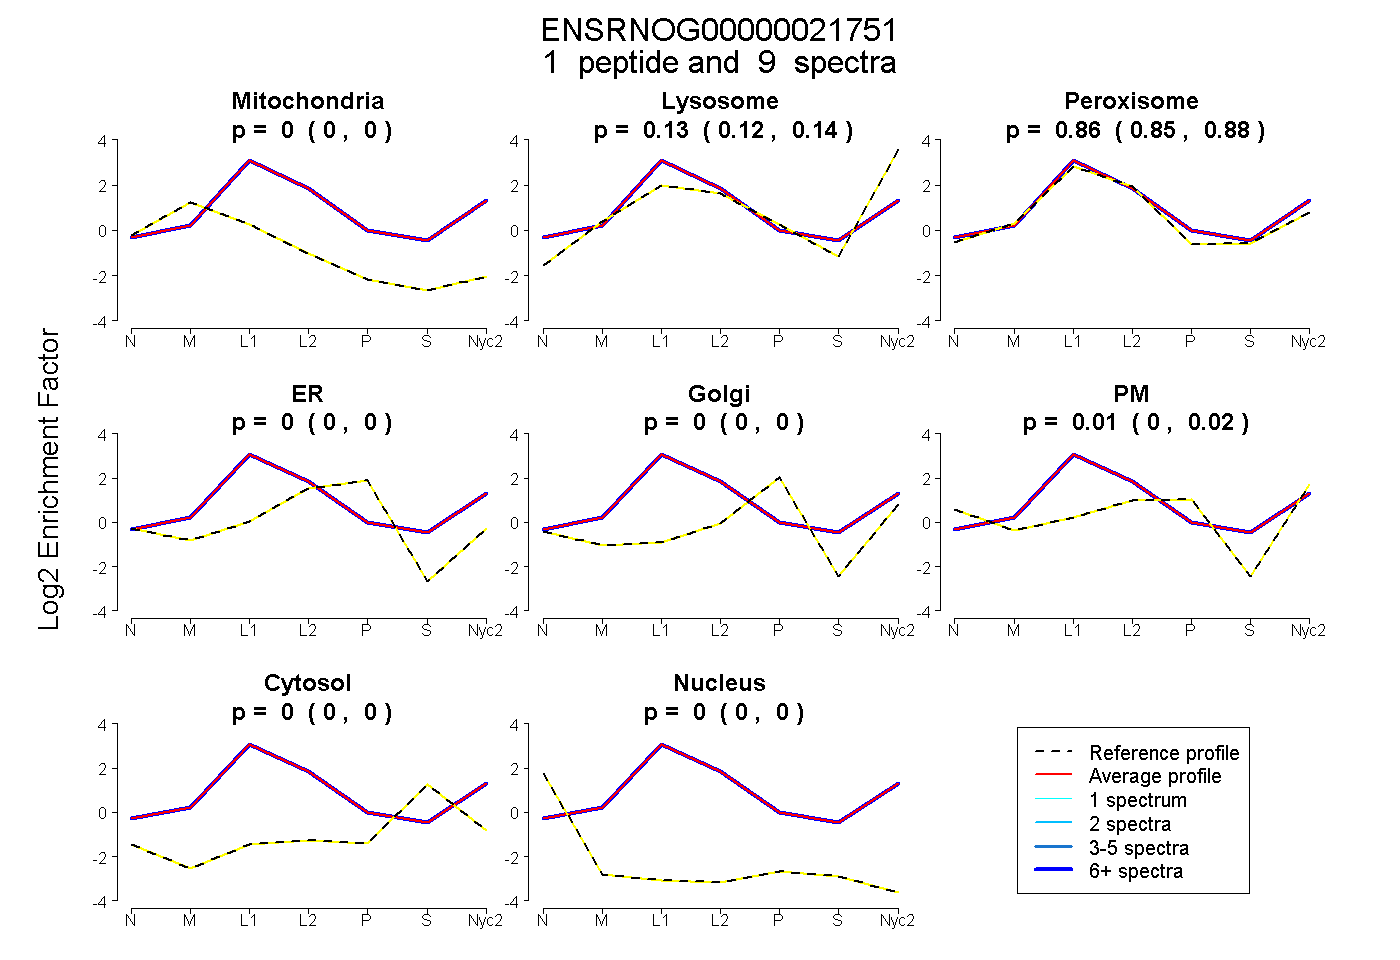
0.000 | 0.000
0.115 | 0.141
0.850 | 0.876
0.000 | 0.000
0.000 | 0.000
0.000 | 0.016
0.000 | 0.000
0.000 | 0.000
1peptide
spectra
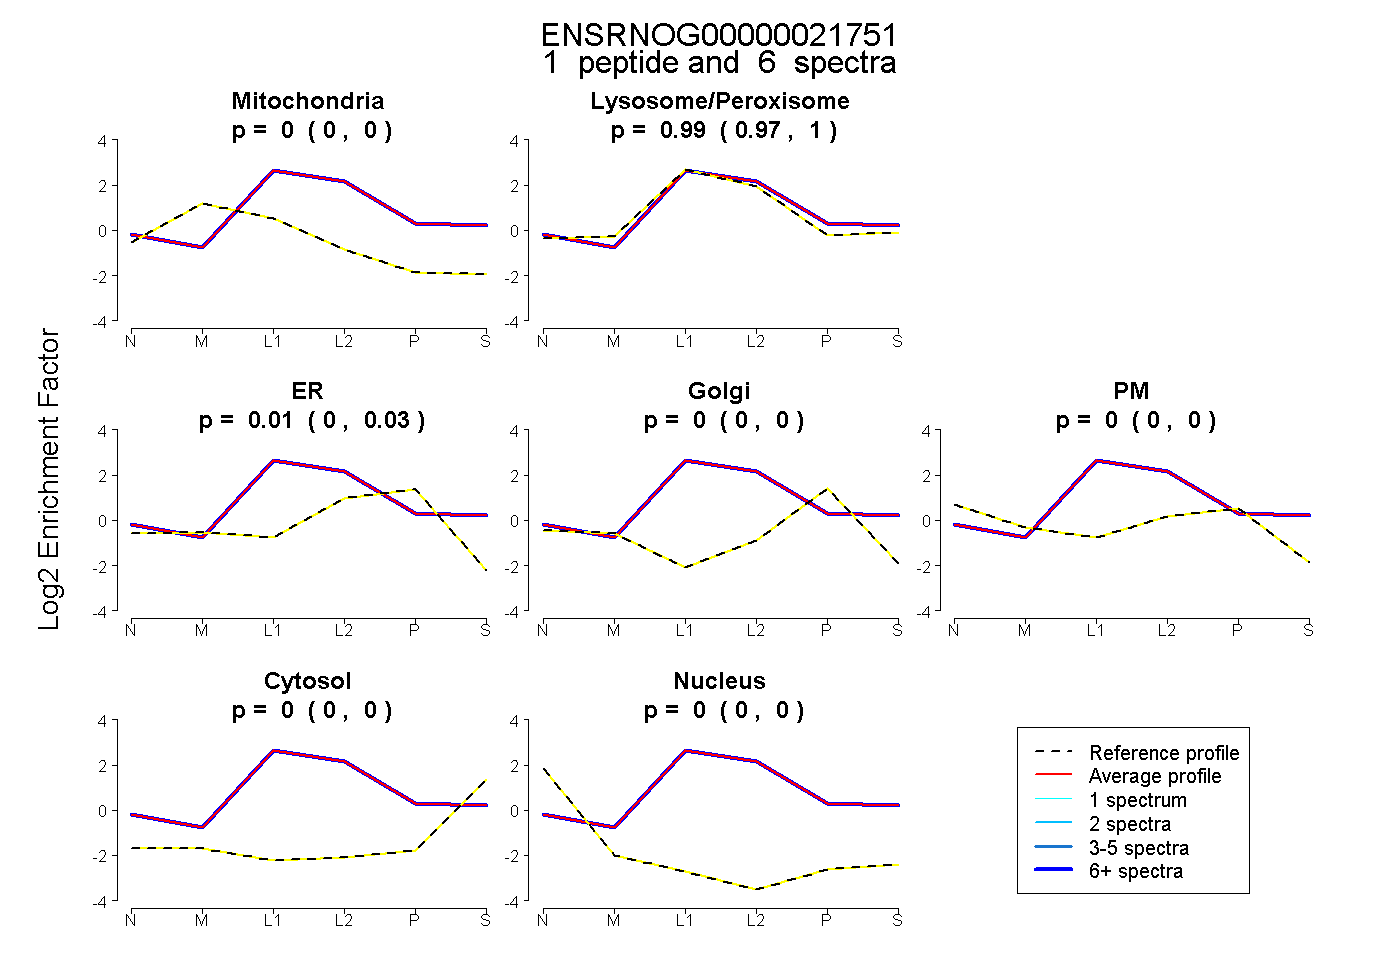
0.000 | 0.000
0.970 | 0.998
0.000 | 0.027
0.000 | 0.000
0.000 | 0.000
0.000 | 0.000
0.000 | 0.000
1peptide
spectra
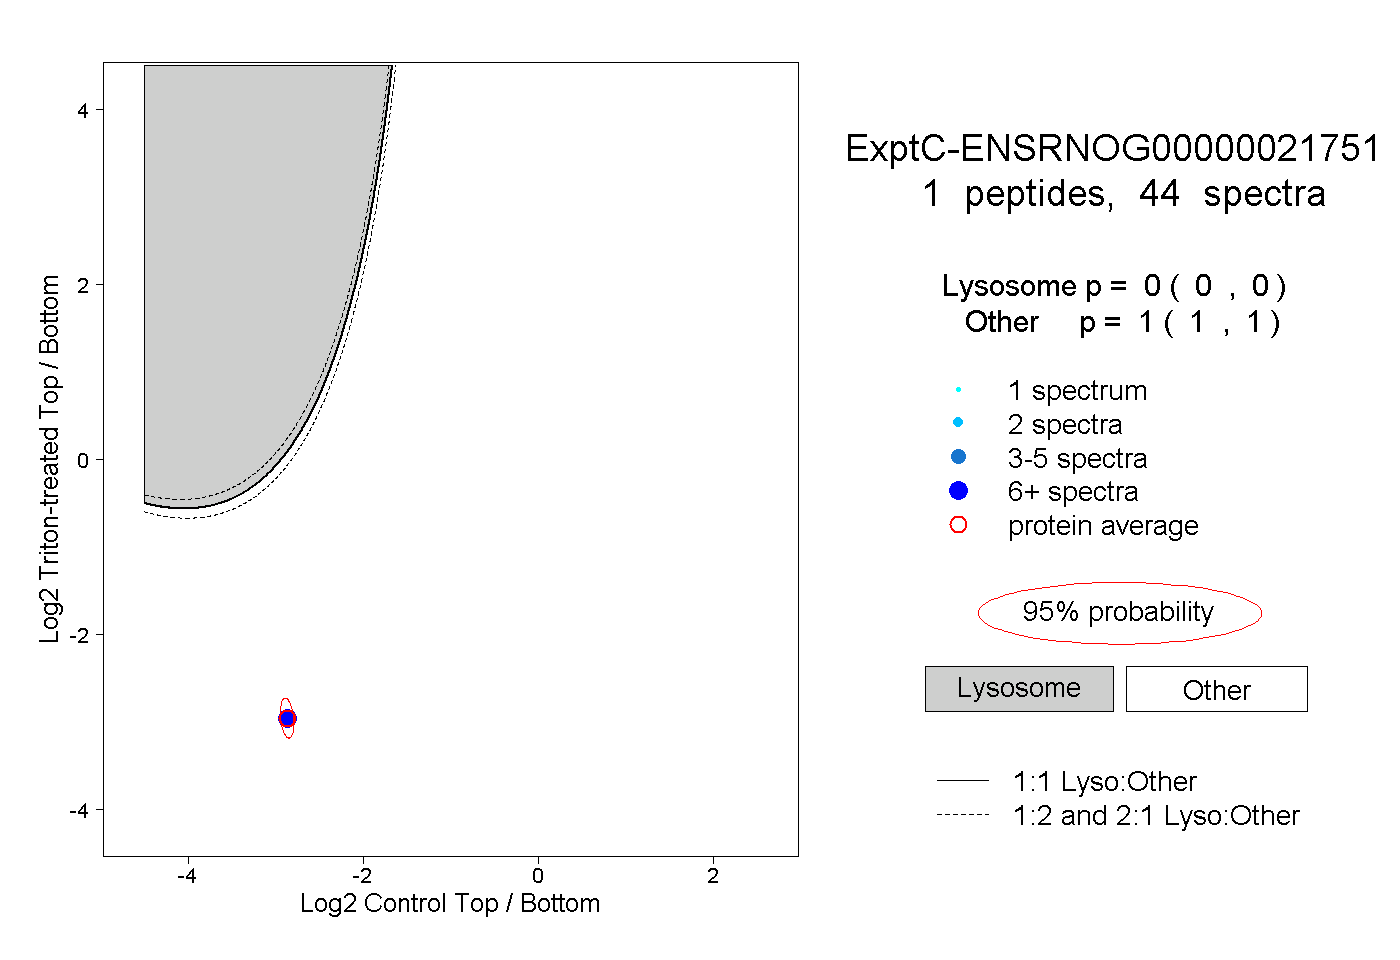
0.000 | 0.000
1.000 | 1.000
1peptide
spectra
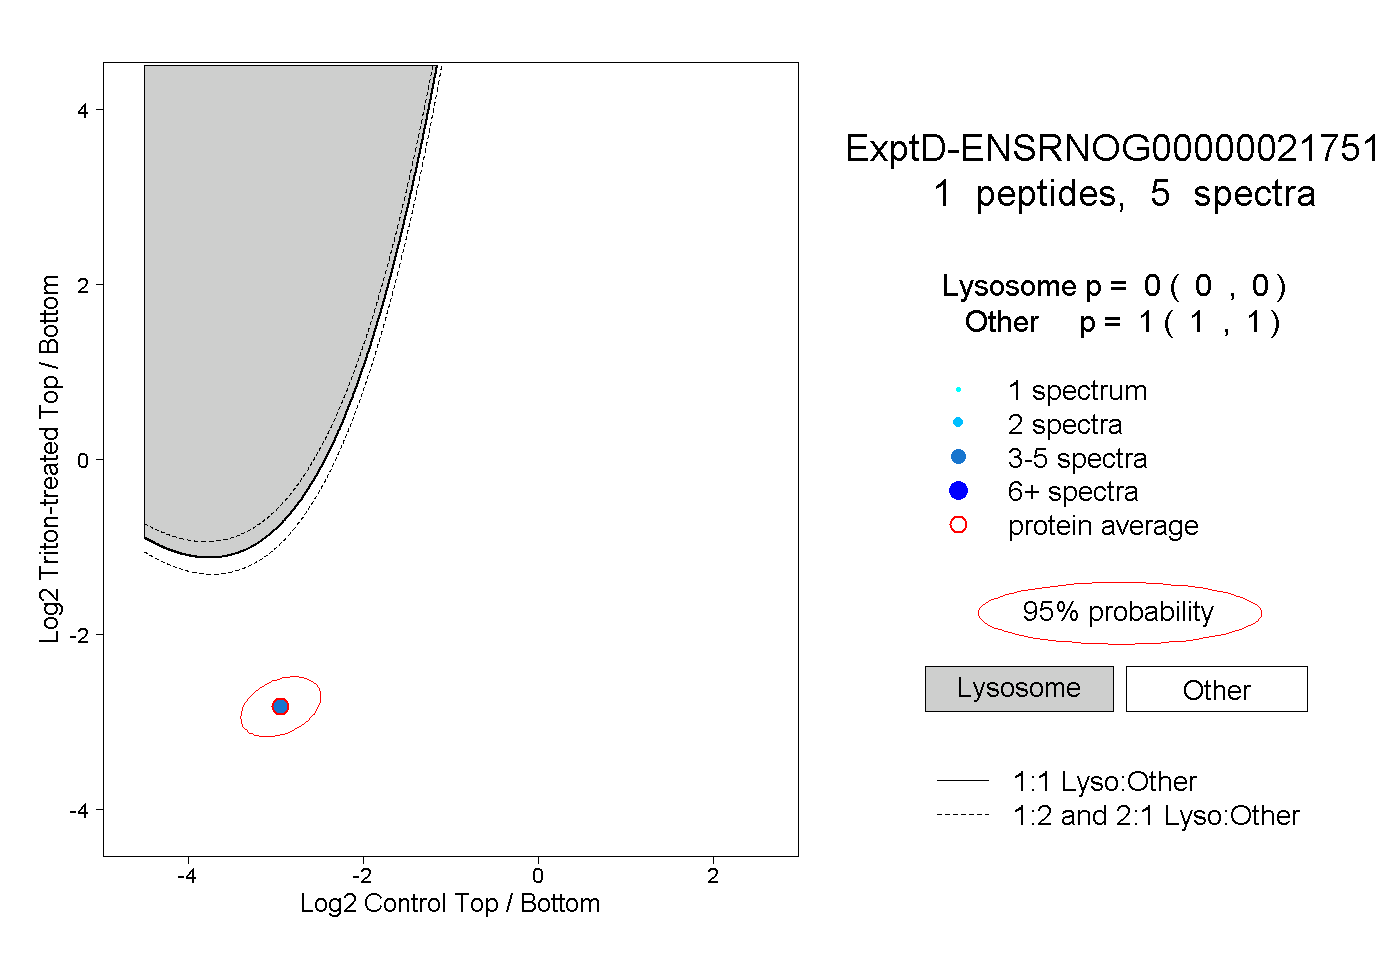
0.000 | 0.000
1.000 | 1.000