 4
4peptides
spectra
0.324 | 0.405
0.000 | 0.013
0.288 | 0.398
0.204 | 0.309
0.000 | 0.000
0.000 | 0.063
0.000 | 0.000
0.000 | 0.000
| Plot | Mito | Lyso | Perox | ER | Golgi | PM | Cytosol | Nucleus | |||||
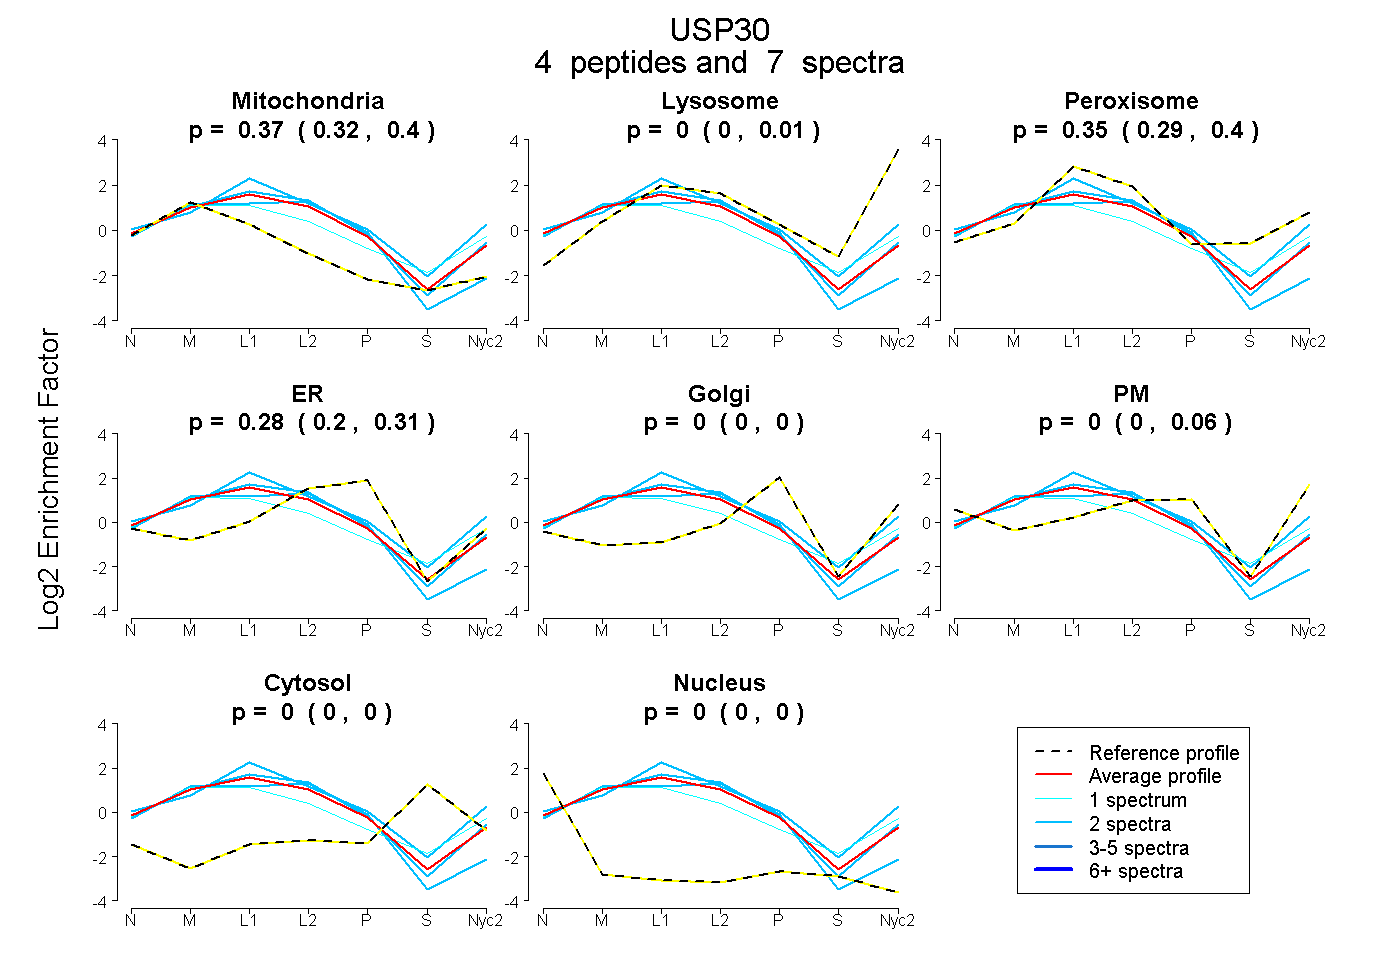
| Expt A |
4 peptides |
7 spectra |
|
0.368 0.324 | 0.405 |
0.000 0.000 | 0.013 |
0.352 0.288 | 0.398 |
0.280 0.204 | 0.309 |
0.000 0.000 | 0.000 |
0.000 0.000 | 0.063 |
0.000 0.000 | 0.000 |
0.000 0.000 | 0.000 |
| 1 spectrum, VTHLFDVHSLEQQSEMAPR | 0.477 | 0.077 | 0.284 | 0.011 | 0.000 | 0.151 | 0.000 | 0.000 | ||
| 2 spectra, LPQCLCIHLQR | 0.516 | 0.000 | 0.057 | 0.427 | 0.000 | 0.000 | 0.000 | 0.000 | ||
| 2 spectra, DVVCDNCTK | 0.325 | 0.000 | 0.371 | 0.304 | 0.000 | 0.000 | 0.000 | 0.000 | ||
| 2 spectra, VQQQGR | 0.172 | 0.000 | 0.558 | 0.093 | 0.000 | 0.177 | 0.000 | 0.000 |
| Plot | Lyso | Other | |||||||||||
| Expt C |
7 peptides |
20 spectra |
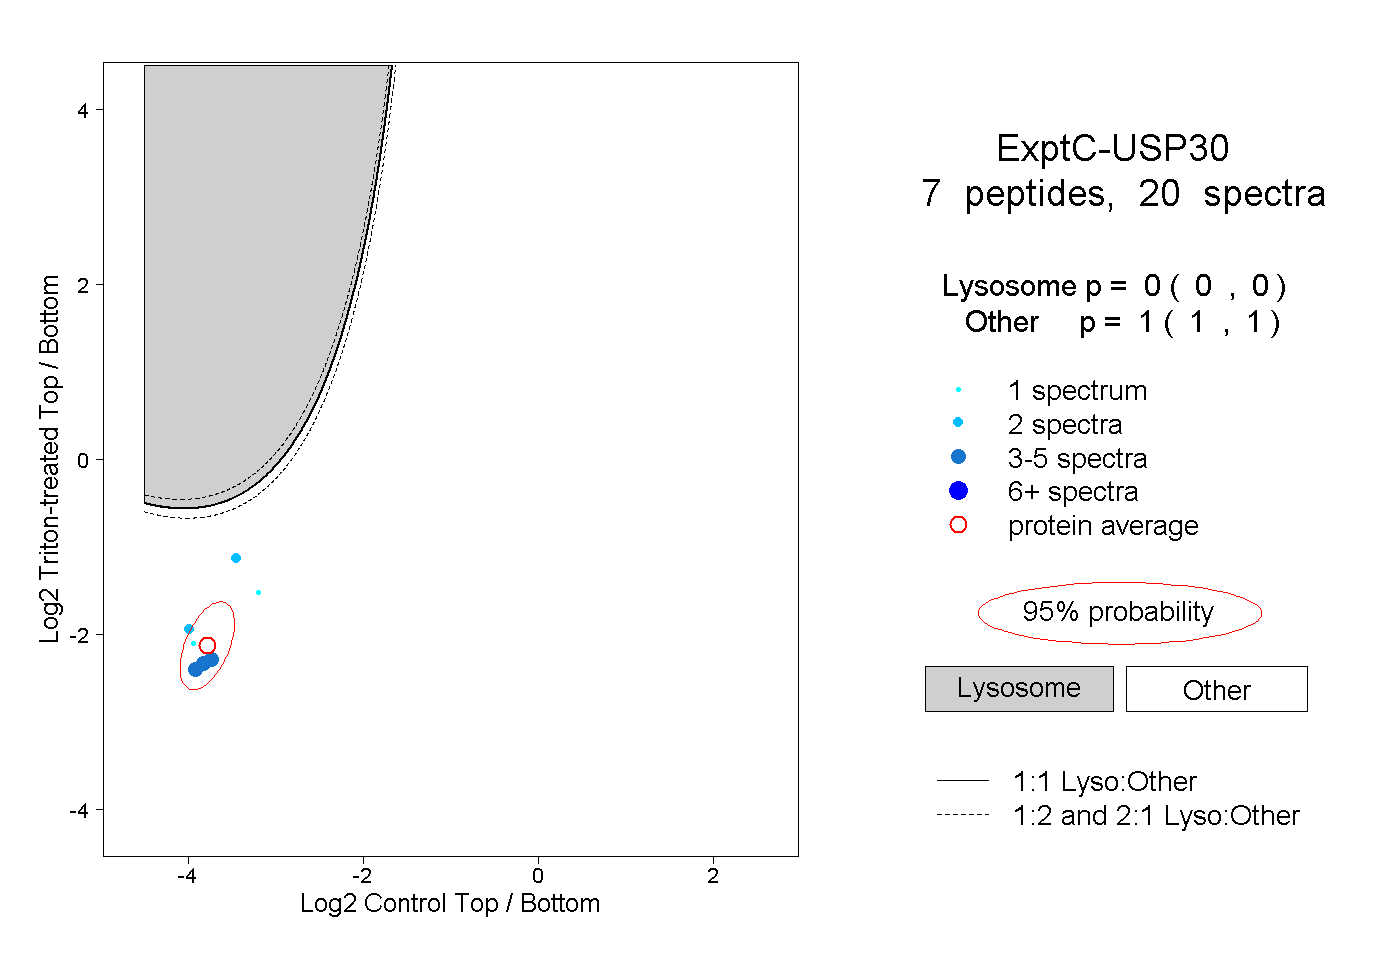 |
0.000 0.000 | 0.000 |
1.000 1.000 | 1.000 |