 5
5peptides
spectra
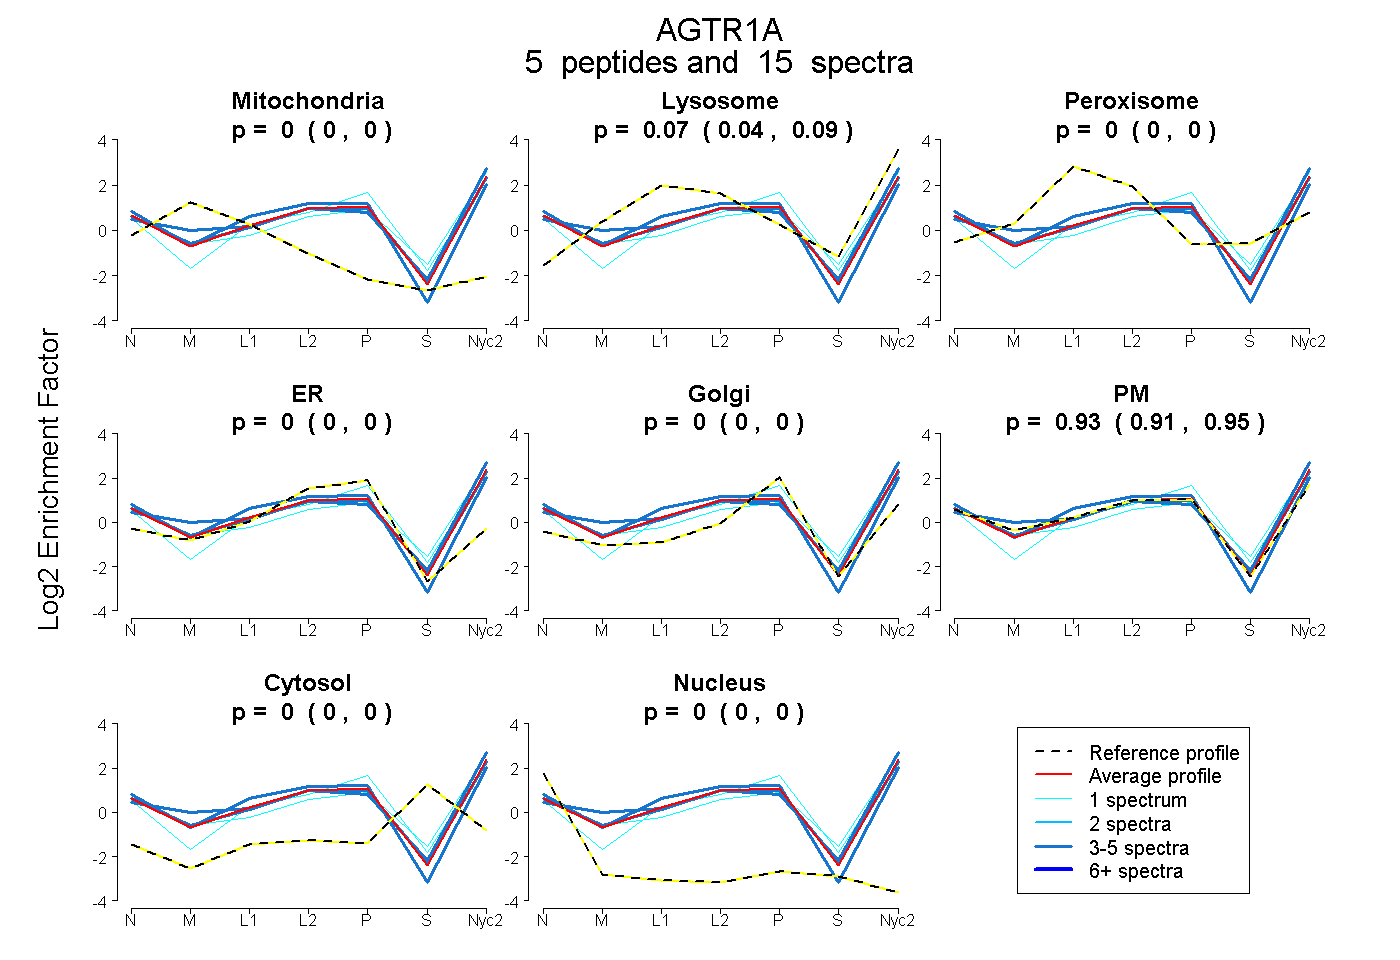
0.000 | 0.000
0.044 | 0.088
0.000 | 0.000
0.000 | 0.000
0.000 | 0.000
0.908 | 0.953
0.000 | 0.000
0.000 | 0.000
6peptides
spectra
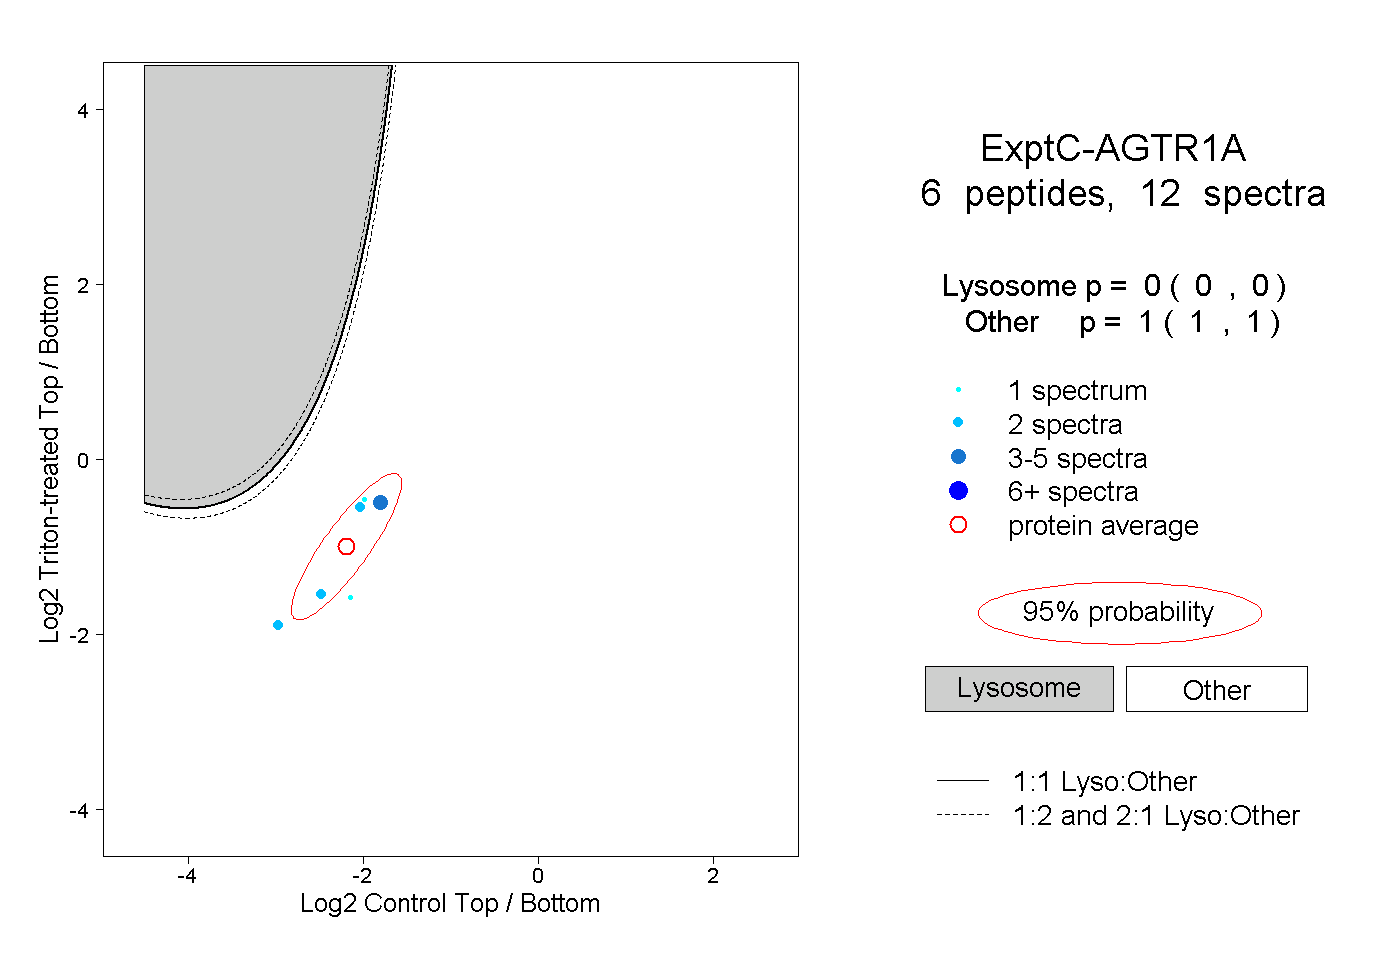
0.000 | 0.000
1.000 | 1.000
1peptide
spectrum
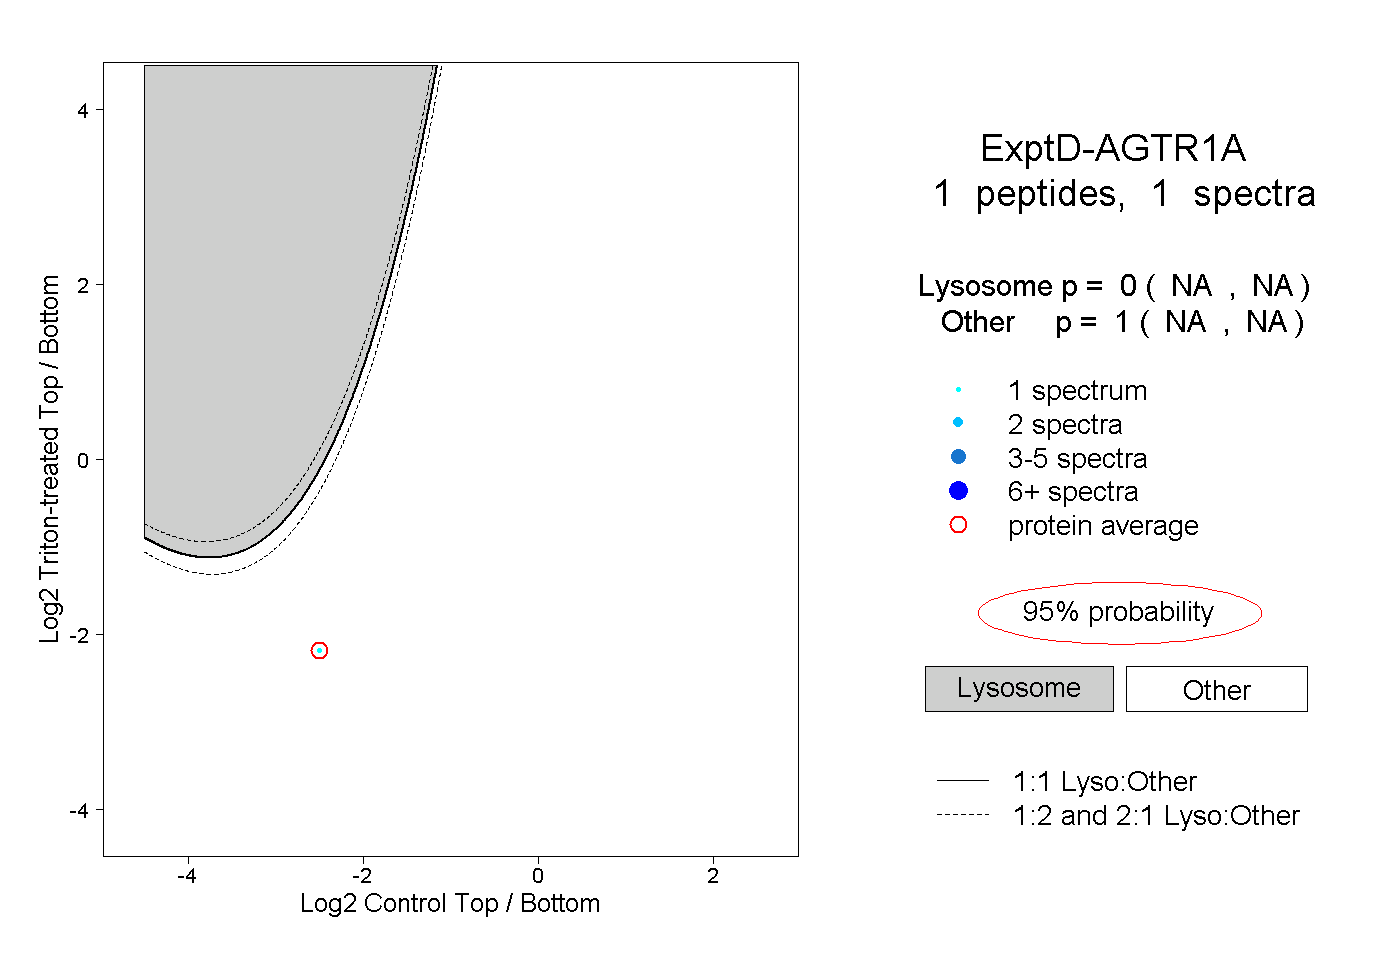
NA | NA
NA | NA