SLC28A2
[ENSRNOP00000034564]
Main page
| | | Plot |
Mito |
Lyso |
|
Perox |
ER |
Golgi |
PM |
Cytosol |
Nucleus |
|
| Expt A |
 7
7
peptides |
17
spectra |
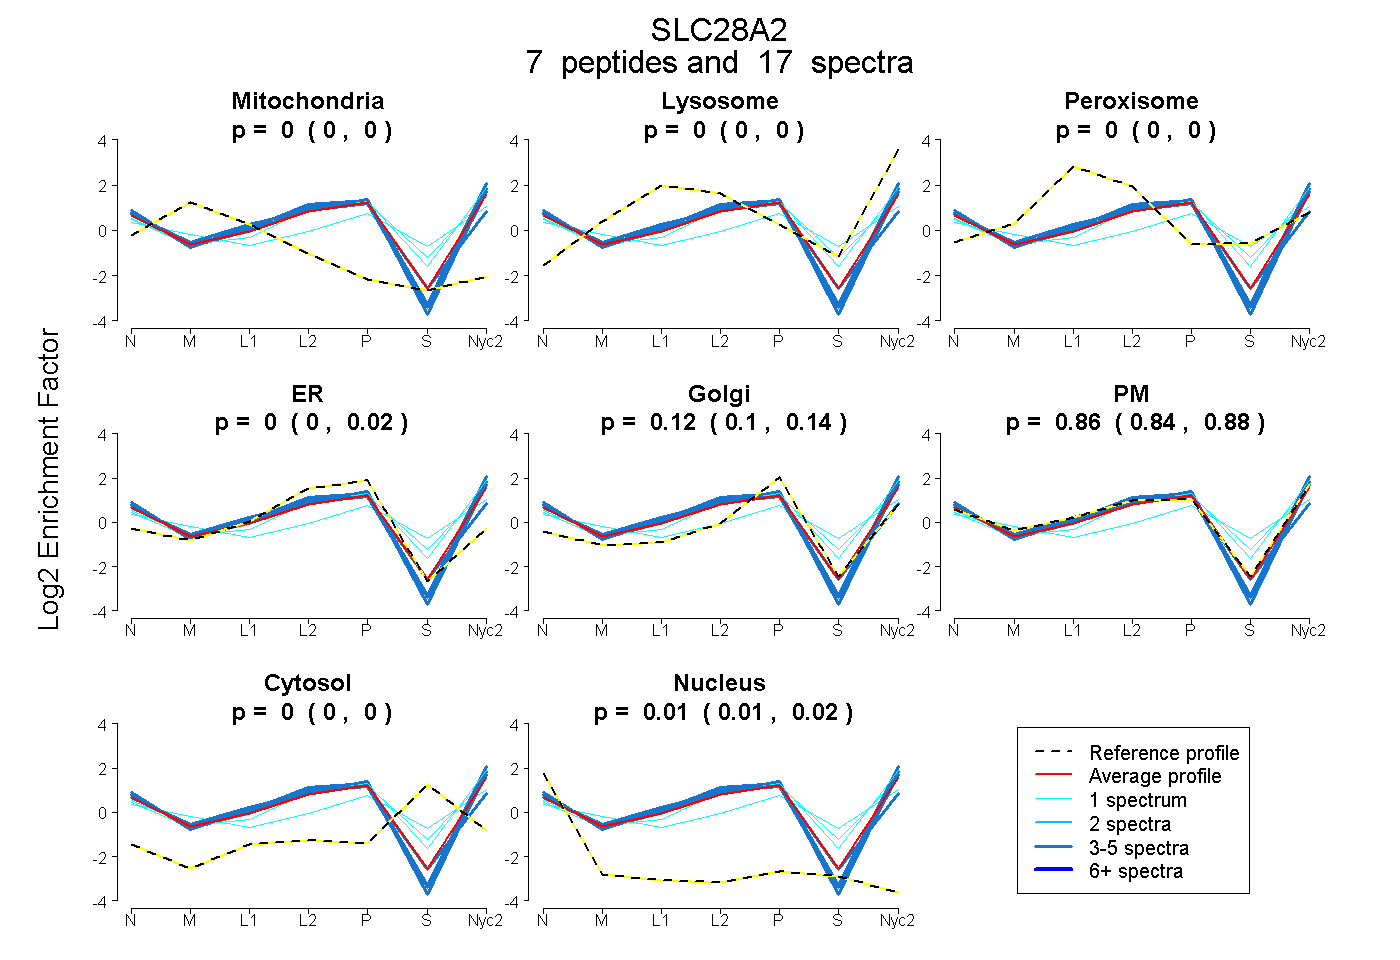 |
0.000
0.000 | 0.000 |
0.000
0.000 | 0.000 |
|
0.000
0.000 | 0.000 |
0.000
0.000 | 0.015 |
0.121
0.097 | 0.136 |
0.865
0.841 | 0.882 |
0.000
0.000 | 0.000 |
0.015
0.008 | 0.020 |
|
| | | Plot |
Mito |
|
Lyso or Perox |
|
ER |
Golgi |
PM |
Cytosol |
Nucleus |
|
| Expt B |
3
peptides |
6
spectra |
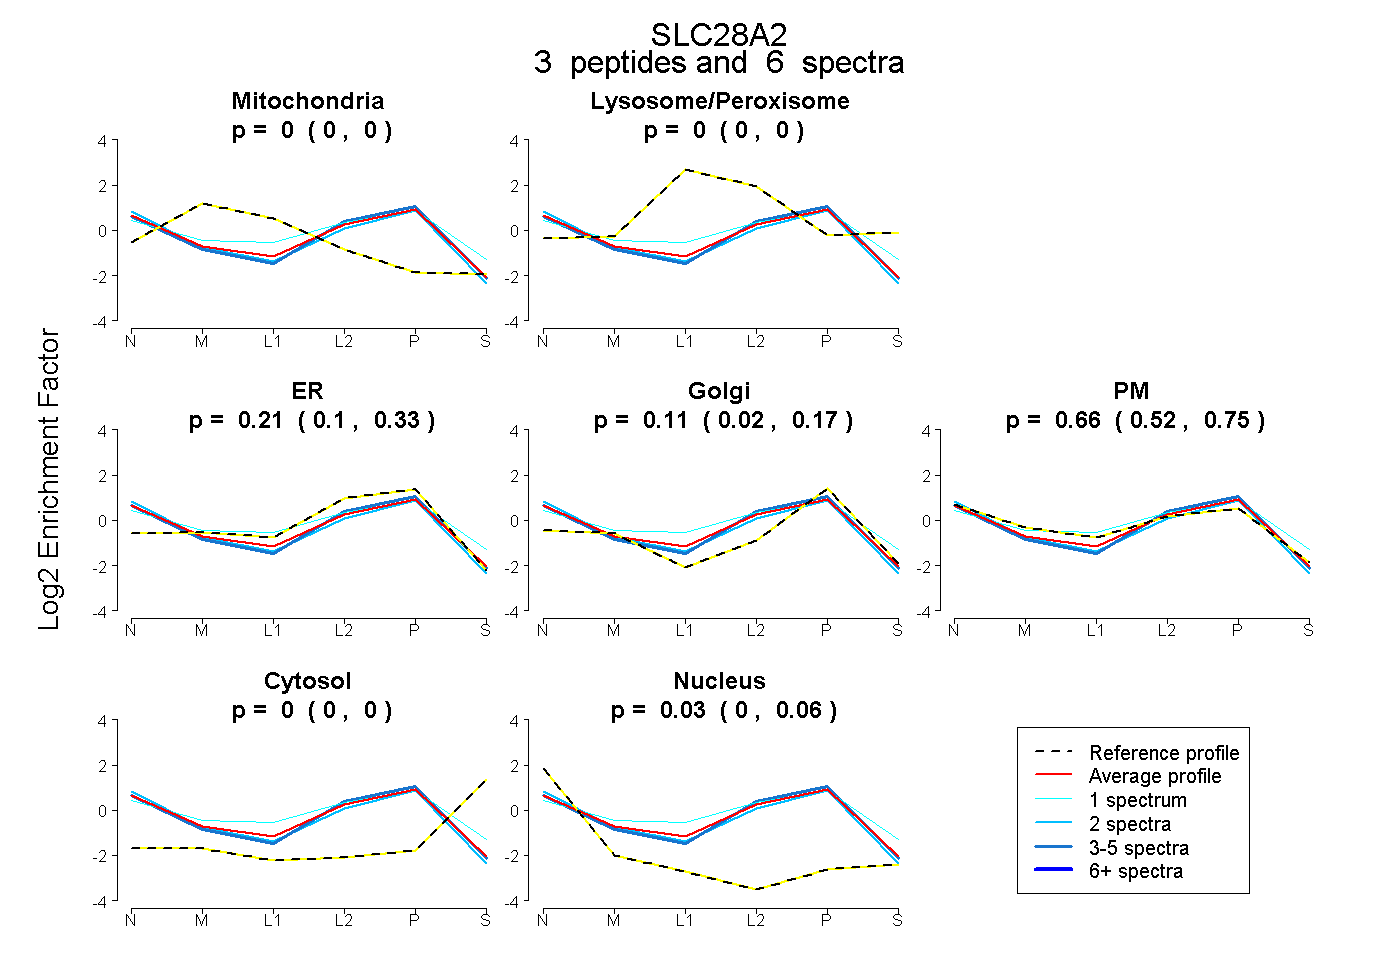 |
0.000
0.000 | 0.000 |
|
0.000
0.000 | 0.000 |
|
0.208
0.096 | 0.332 |
0.110
0.025 | 0.173 |
0.656
0.517 | 0.750 |
0.000
0.000 | 0.000 |
0.026
0.000 | 0.060 |
|
| 1 spectrum, TLEEVTQGHSLK |
0.000 |
|
0.186 |
|
0.000 |
0.249 |
0.565 |
0.000 |
0.000 |
|
| 2 spectra, ILQPFTK |
0.000 |
|
0.000 |
|
0.189 |
0.128 |
0.609 |
0.000 |
0.074 |
|
| 3 spectra, LVYPEVEESK |
0.000 |
|
0.000 |
|
0.291 |
0.161 |
0.508 |
0.000 |
0.040 |
|
| | | Plot |
|
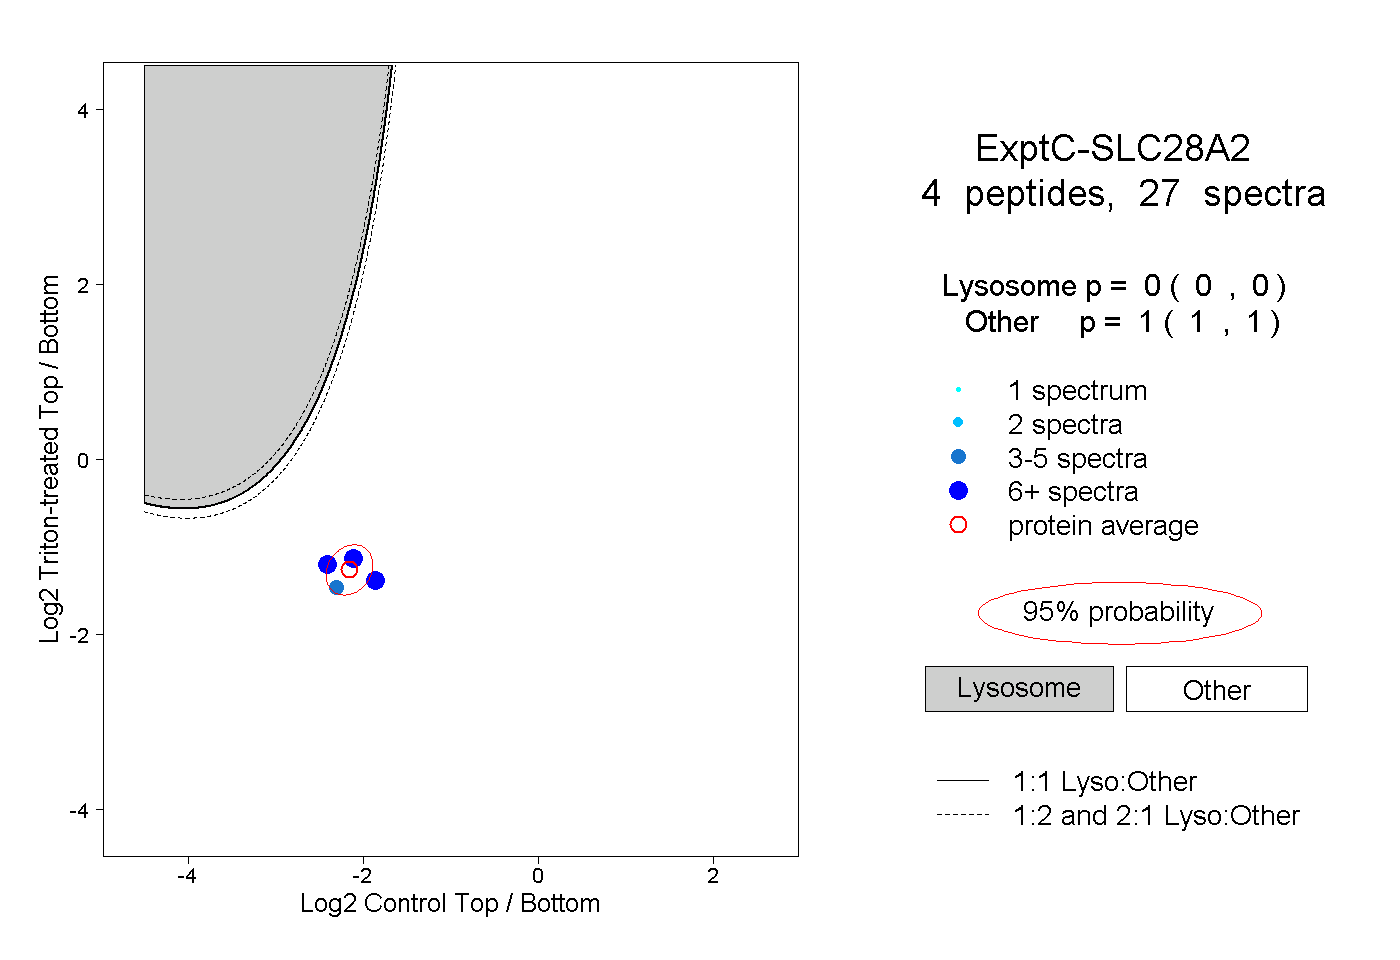
Lyso |
|
|
|
|
|
|
|
Other |
| Expt C |
4
peptides |
27
spectra |
 |
|
0.000
0.000 | 0.000 |
|
|
|
|
|
|
|
1.000
1.000 | 1.000 |
| | | Plot |
|
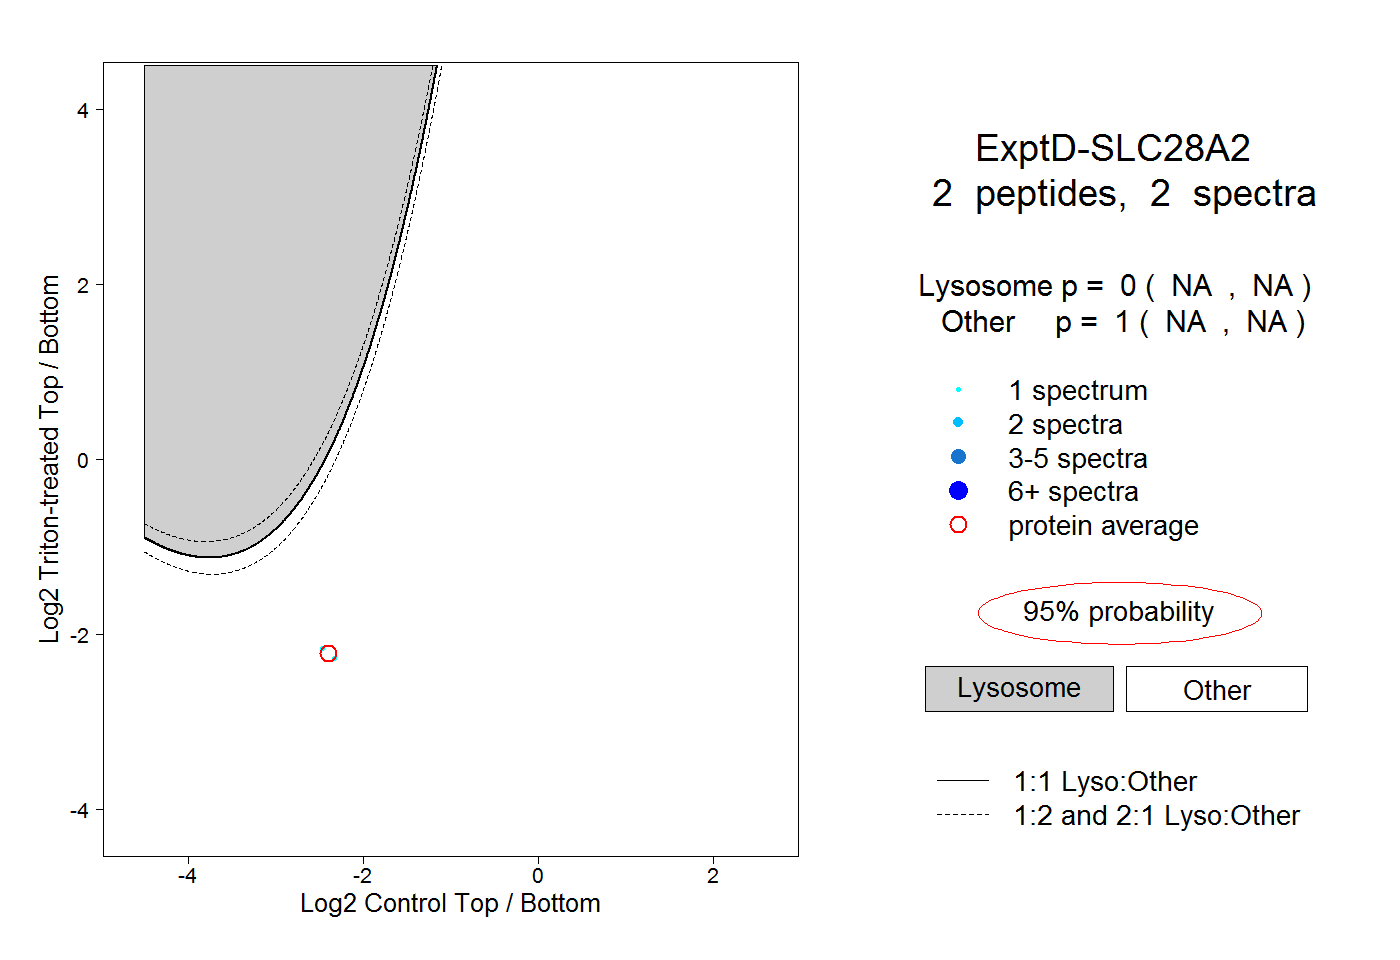
Lyso |
|
|
|
|
|
|
|
Other |
| Expt D |
2
peptides |
2
spectra |
 |
|
0.000
NA | NA |
|
|
|
|
|
|
|
1.000
NA | NA |