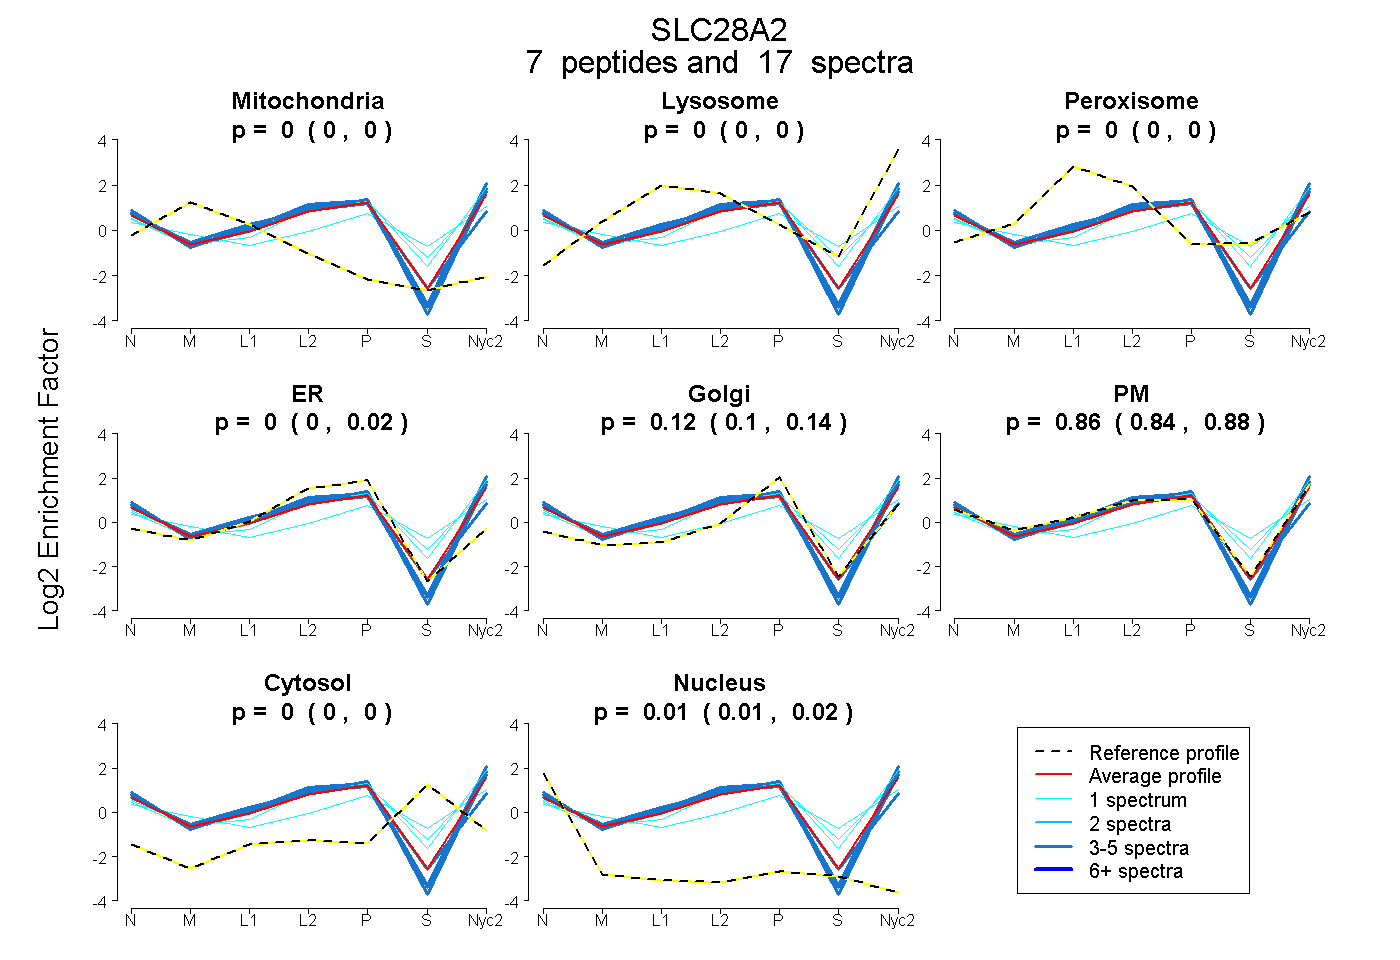
 7
7peptides
spectra
0.000 | 0.000
0.000 | 0.000
0.000 | 0.000
0.000 | 0.015
0.097 | 0.136
0.841 | 0.882
0.000 | 0.000
0.008 | 0.020
| Plot | Mito | Lyso | Perox | ER | Golgi | PM | Cytosol | Nucleus | |||||
| Expt A |
7 peptides |
17 spectra |
|
0.000 0.000 | 0.000 |
0.000 0.000 | 0.000 |
0.000 0.000 | 0.000 |
0.000 0.000 | 0.015 |
0.121 0.097 | 0.136 |
0.865 0.841 | 0.882 |
0.000 0.000 | 0.000 |
0.015 0.008 | 0.020 |
| 3 spectra, TLEEVTQGHSLK | 0.000 | 0.000 | 0.000 | 0.010 | 0.000 | 0.974 | 0.000 | 0.016 | ||
| 1 spectrum, CLKPLK | 0.000 | 0.051 | 0.000 | 0.022 | 0.011 | 0.780 | 0.136 | 0.000 | ||
| 3 spectra, TYETYVCCR | 0.004 | 0.000 | 0.006 | 0.249 | 0.000 | 0.699 | 0.000 | 0.043 | ||
| 1 spectrum, QWISVK | 0.000 | 0.037 | 0.000 | 0.000 | 0.100 | 0.793 | 0.069 | 0.000 | ||
| 4 spectra, LVYPEVEESK | 0.000 | 0.000 | 0.000 | 0.000 | 0.085 | 0.915 | 0.000 | 0.000 | ||
| 1 spectrum, FFINEFVAYQQLSQYK | 0.000 | 0.000 | 0.000 | 0.000 | 0.053 | 0.661 | 0.286 | 0.000 | ||
| 4 spectra, ILQPFTK | 0.000 | 0.000 | 0.000 | 0.000 | 0.000 | 1.000 | 0.000 | 0.000 |
| Plot | Mito | Lyso or Perox | ER | Golgi | PM | Cytosol | Nucleus | ||||||
| Expt B |
3 peptides |
6 spectra |
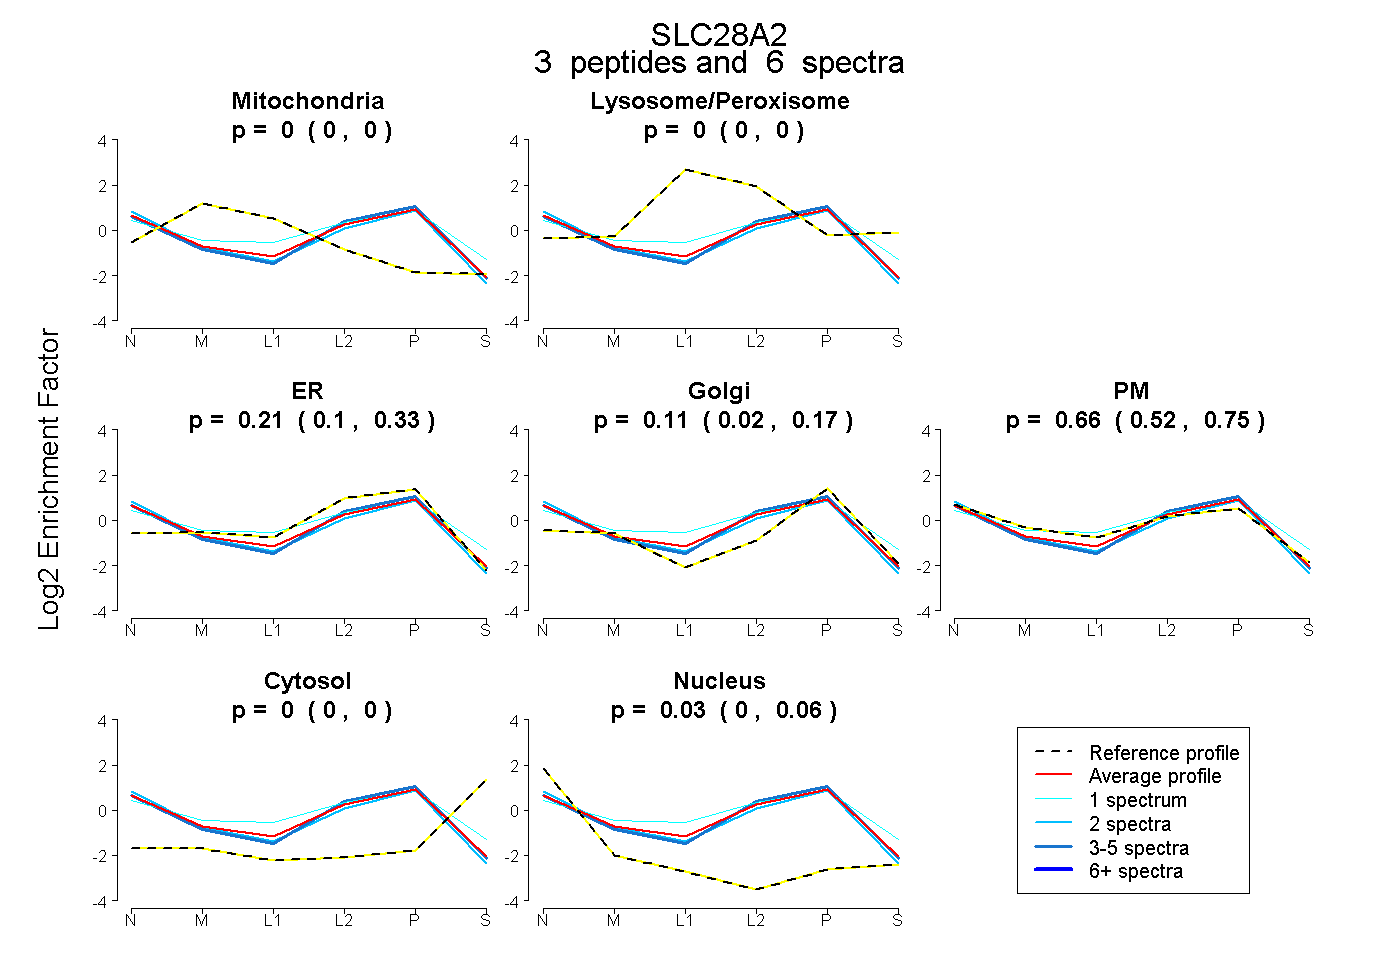 |
0.000 0.000 | 0.000 |
0.000 0.000 | 0.000 |
0.208 0.096 | 0.332 |
0.110 0.025 | 0.173 |
0.656 0.517 | 0.750 |
0.000 0.000 | 0.000 |
0.026 0.000 | 0.060 |
|||
| Plot | Lyso | Other | |||||||||||
| Expt C |
4 peptides |
27 spectra |
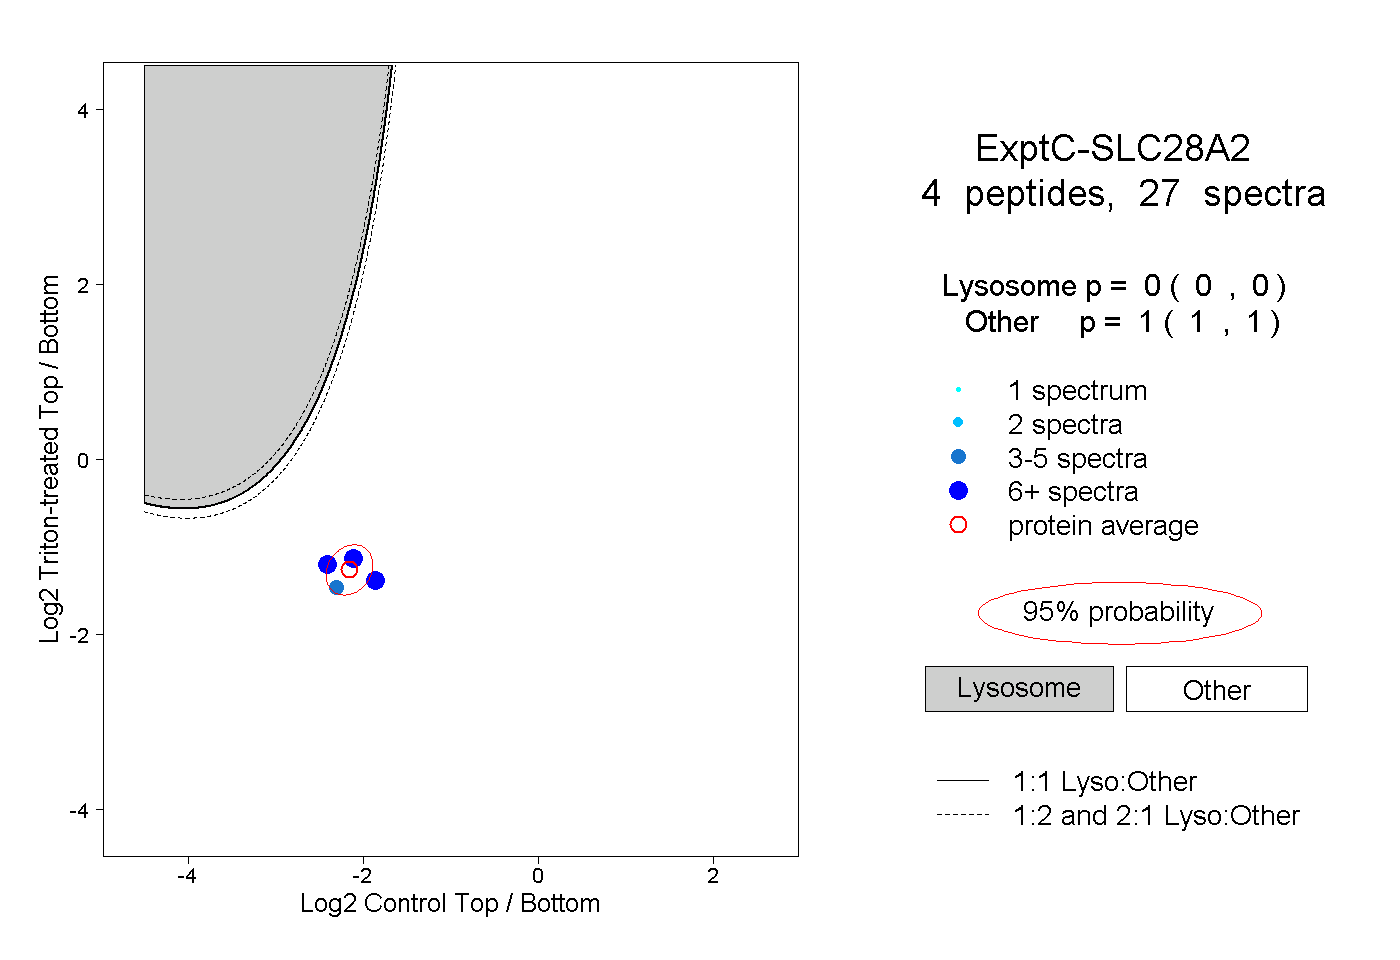 |
0.000 0.000 | 0.000 |
1.000 1.000 | 1.000 |
||||||||
| Plot | Lyso | Other | |||||||||||
| Expt D |
2 peptides |
2 spectra |
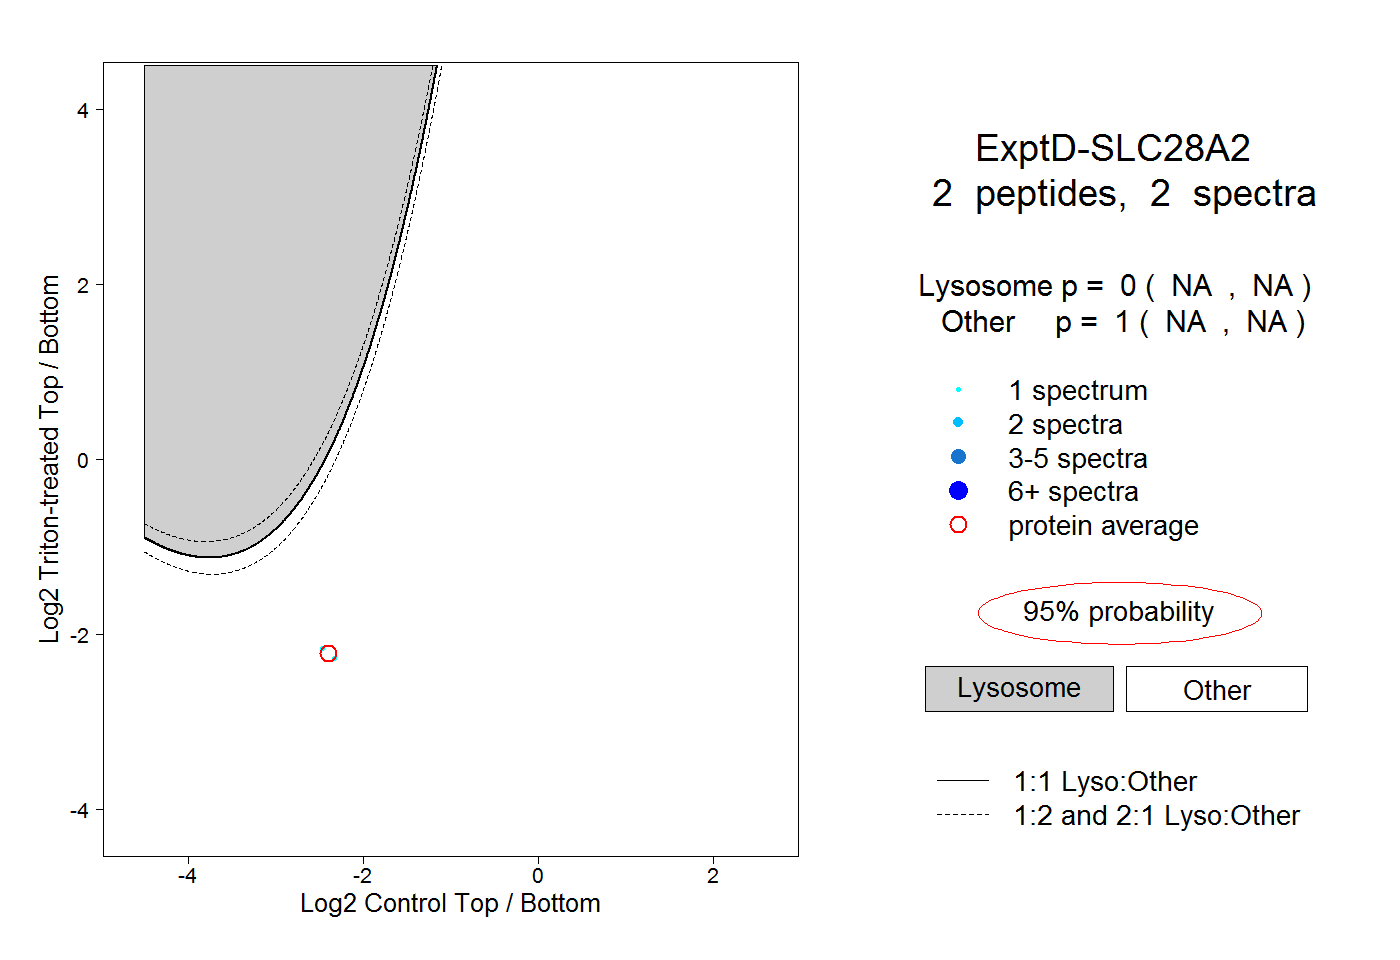 |
0.000 NA | NA |
1.000 NA | NA |