 17
17peptides
spectra
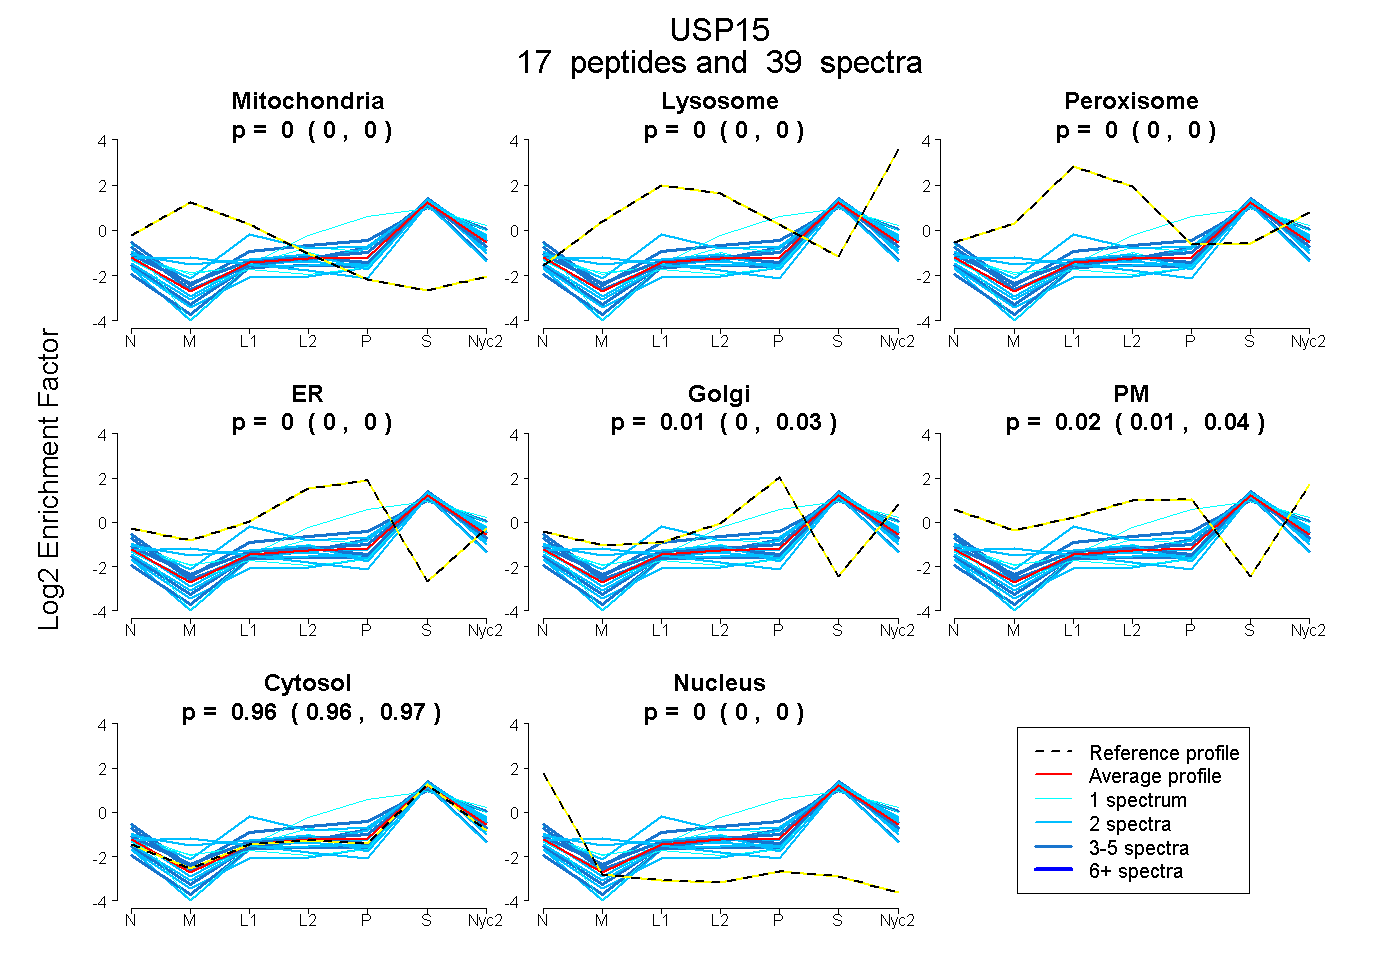
0.000 | 0.000
0.000 | 0.000
0.000 | 0.000
0.000 | 0.000
0.000 | 0.029
0.006 | 0.035
0.958 | 0.969
0.000 | 0.000
| Plot | Mito | Lyso | Perox | ER | Golgi | PM | Cytosol | Nucleus | |||||
| Expt A |
17 peptides |
39 spectra |
|
0.000 0.000 | 0.000 |
0.000 0.000 | 0.000 |
0.000 0.000 | 0.000 |
0.000 0.000 | 0.000 |
0.013 0.000 | 0.029 |
0.023 0.006 | 0.035 |
0.964 0.958 | 0.969 |
0.000 0.000 | 0.000 |
| 2 spectra, VEVYLTELK | 0.181 | 0.000 | 0.000 | 0.000 | 0.000 | 0.000 | 0.808 | 0.011 | ||
| 2 spectra, MIVTDIYNHR | 0.000 | 0.000 | 0.210 | 0.000 | 0.024 | 0.000 | 0.767 | 0.000 | ||
| 1 spectrum, SFLALDWDPDLK | 0.000 | 0.000 | 0.000 | 0.000 | 0.000 | 0.000 | 0.980 | 0.020 | ||
| 3 spectra, SYAELIK | 0.000 | 0.000 | 0.000 | 0.000 | 0.030 | 0.049 | 0.921 | 0.000 | ||
| 1 spectrum, STLVCPECAK | 0.000 | 0.000 | 0.000 | 0.000 | 0.289 | 0.000 | 0.711 | 0.000 | ||
| 4 spectra, AAYVLFYQR | 0.000 | 0.000 | 0.000 | 0.000 | 0.025 | 0.000 | 0.975 | 0.000 | ||
| 1 spectrum, NDSIIVDIFHGLFK | 0.003 | 0.079 | 0.000 | 0.000 | 0.000 | 0.000 | 0.918 | 0.000 | ||
| 3 spectra, TEDTEHVVIPVCLR | 0.000 | 0.000 | 0.009 | 0.000 | 0.000 | 0.000 | 0.898 | 0.093 | ||
| 2 spectra, VVAEEAWENHLK | 0.090 | 0.071 | 0.000 | 0.000 | 0.000 | 0.000 | 0.839 | 0.000 | ||
| 1 spectrum, EHQQATK | 0.000 | 0.066 | 0.000 | 0.000 | 0.000 | 0.094 | 0.840 | 0.000 | ||
| 2 spectra, SLEVYLVR | 0.000 | 0.000 | 0.000 | 0.000 | 0.000 | 0.000 | 1.000 | 0.000 | ||
| 2 spectra, DADGRPDK | 0.000 | 0.000 | 0.000 | 0.000 | 0.000 | 0.000 | 0.947 | 0.053 | ||
| 4 spectra, MSTETEETDGPLR | 0.000 | 0.000 | 0.000 | 0.000 | 0.000 | 0.000 | 1.000 | 0.000 | ||
| 2 spectra, GQLTGHK | 0.000 | 0.000 | 0.000 | 0.000 | 0.000 | 0.000 | 1.000 | 0.000 | ||
| 5 spectra, ADTIDTIEK | 0.000 | 0.005 | 0.000 | 0.000 | 0.000 | 0.224 | 0.771 | 0.000 | ||
| 2 spectra, NEDGTWPR | 0.000 | 0.000 | 0.000 | 0.000 | 0.077 | 0.000 | 0.923 | 0.000 | ||
| 2 spectra, QDTFSGTGFFPLDR | 0.000 | 0.011 | 0.000 | 0.000 | 0.000 | 0.000 | 0.989 | 0.000 |
| Plot | Mito | Lyso or Perox | ER | Golgi | PM | Cytosol | Nucleus | ||||||
| Expt B |
3 peptides |
3 spectra |
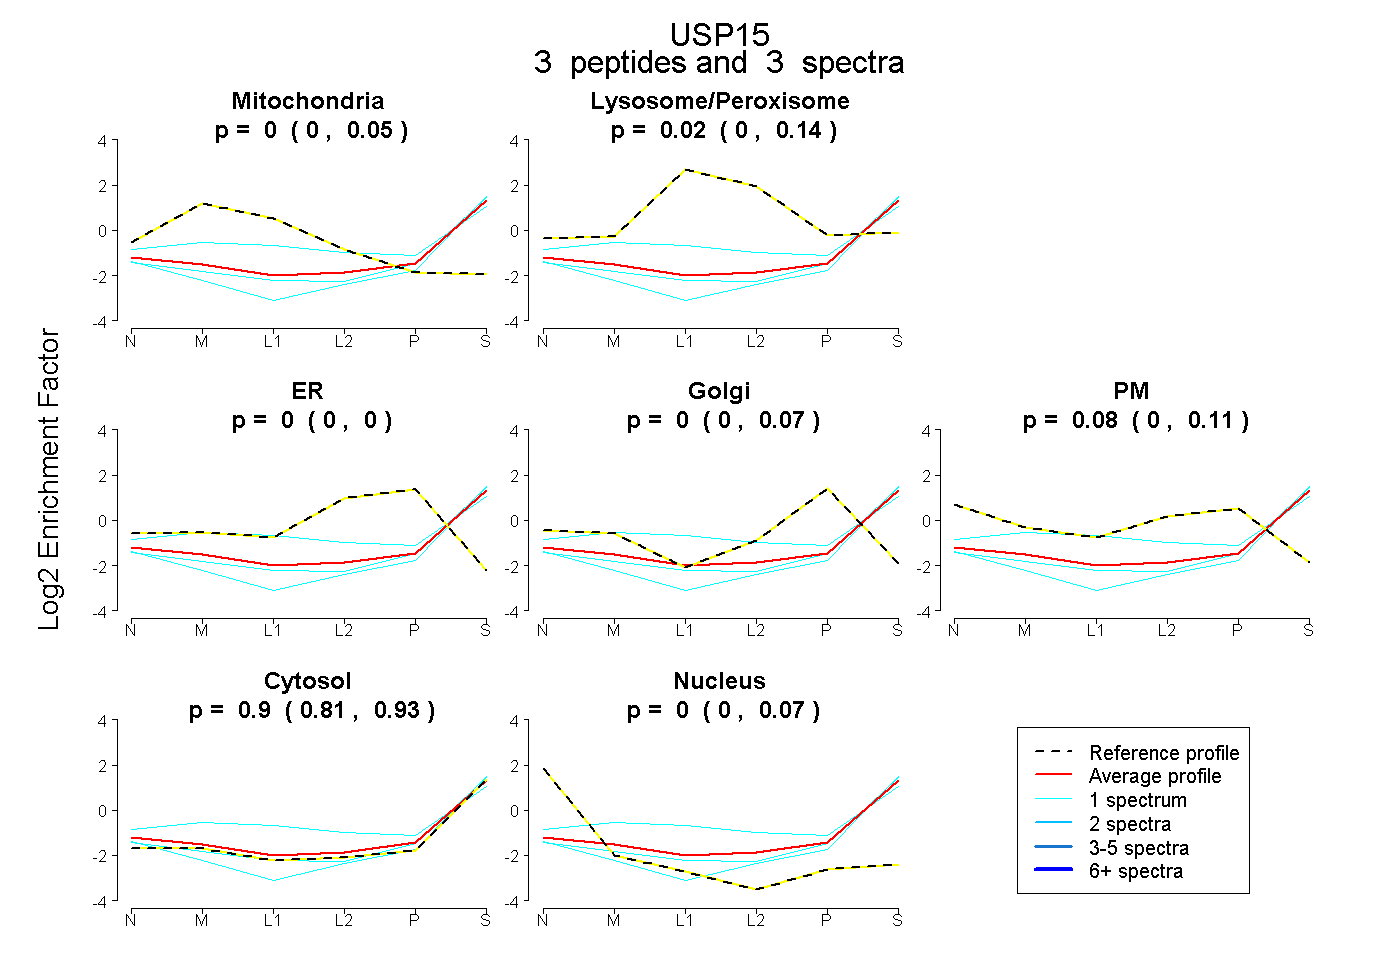 |
0.000 0.000 | 0.054 |
0.022 0.000 | 0.139 |
0.000 0.000 | 0.000 |
0.000 0.000 | 0.070 |
0.078 0.000 | 0.108 |
0.898 0.806 | 0.928 |
0.002 0.000 | 0.066 |
|||
| Plot | Lyso | Other | |||||||||||
| Expt C |
13 peptides |
25 spectra |
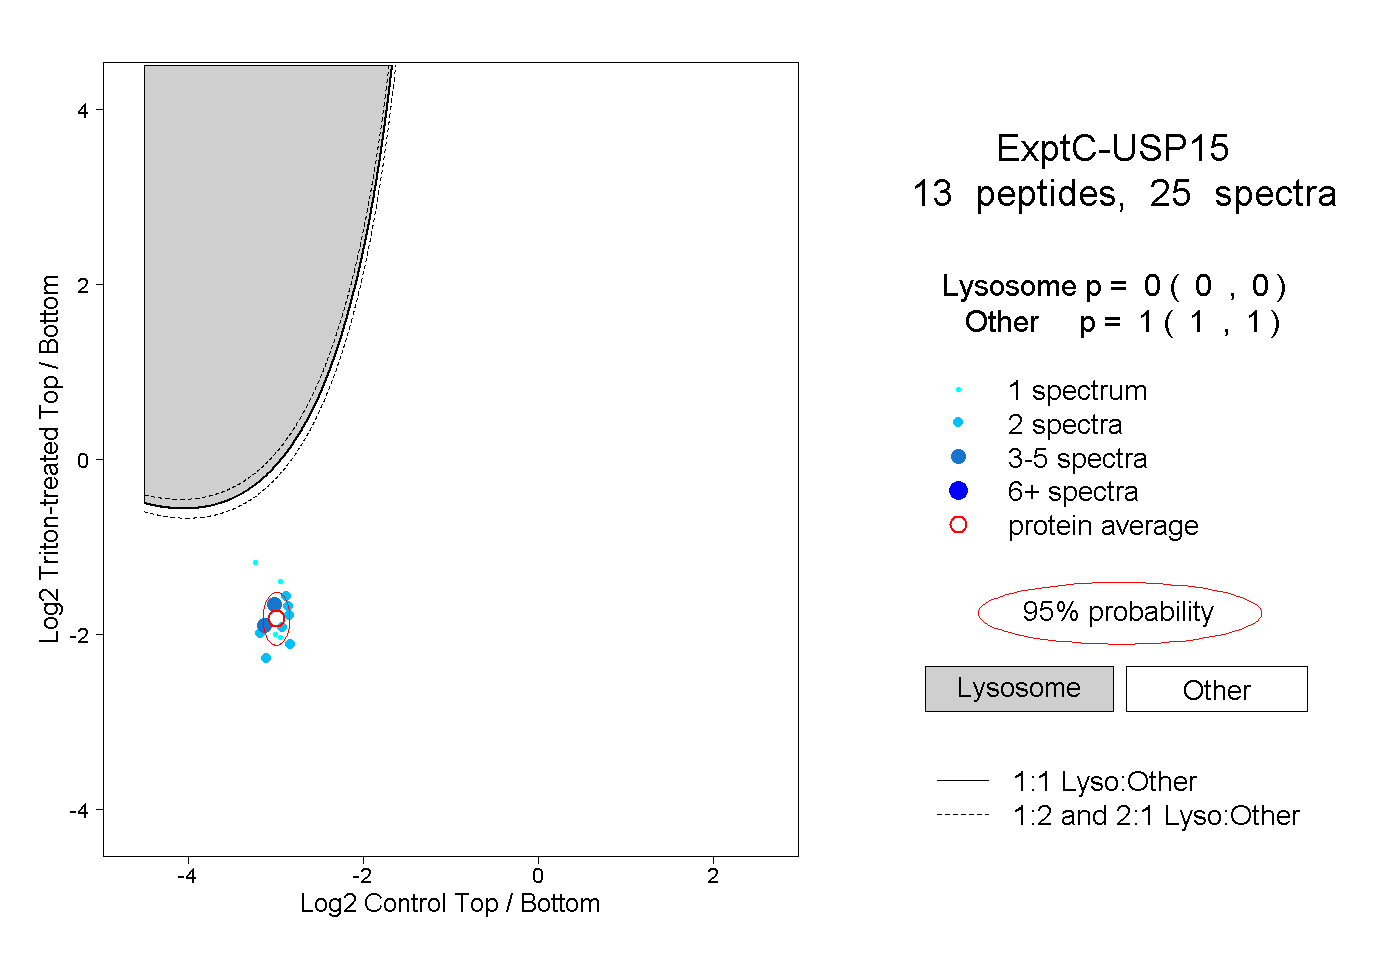 |
0.000 0.000 | 0.000 |
1.000 1.000 | 1.000 |