 17
17peptides
spectra
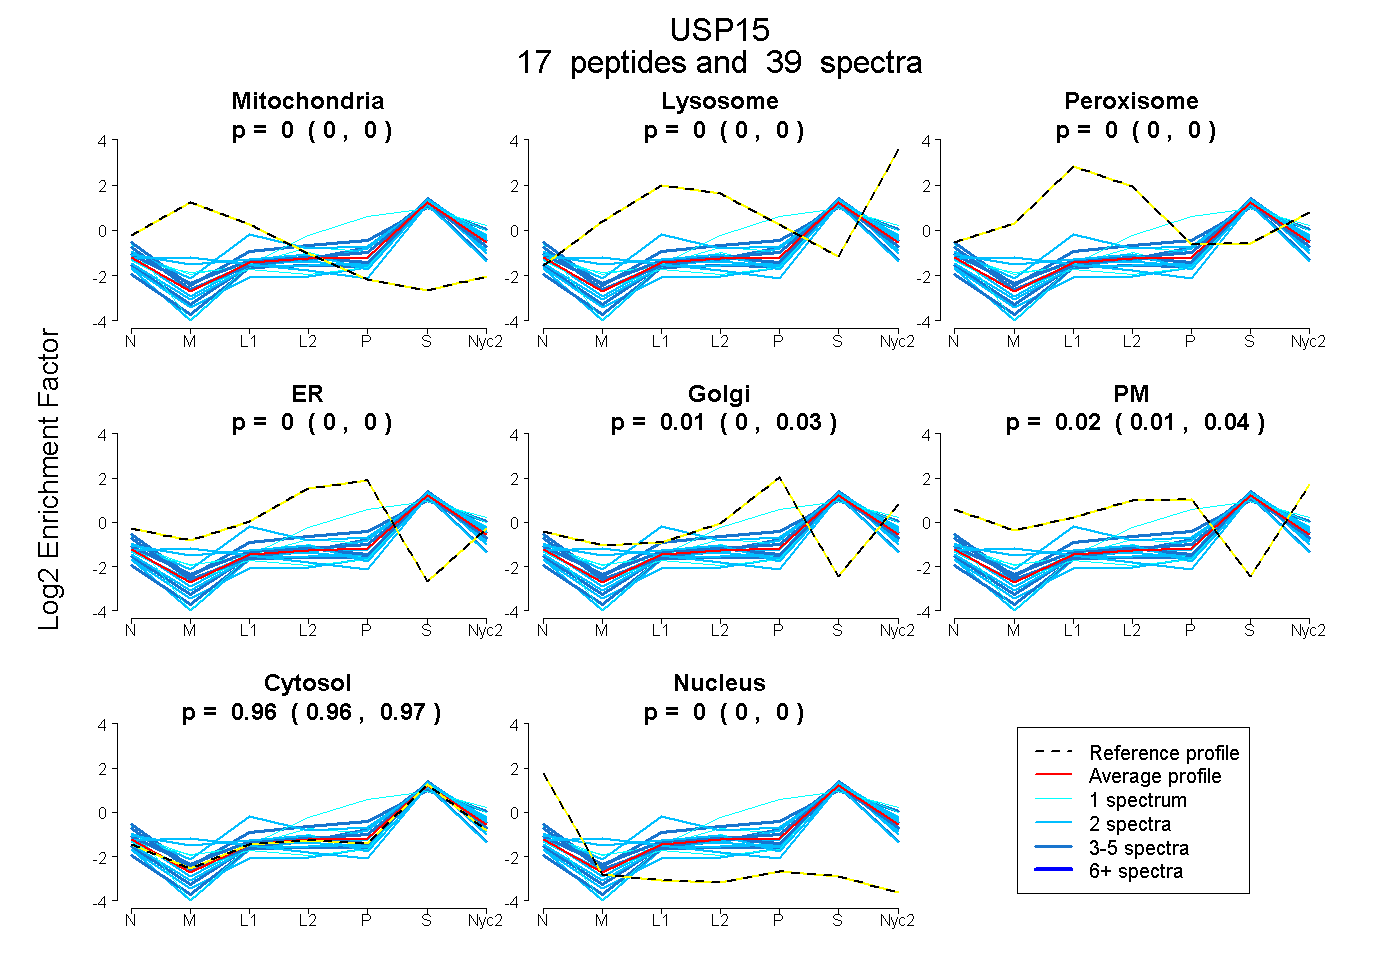
0.000 | 0.000
0.000 | 0.000
0.000 | 0.000
0.000 | 0.000
0.000 | 0.029
0.006 | 0.035
0.958 | 0.969
0.000 | 0.000
3peptides
spectra
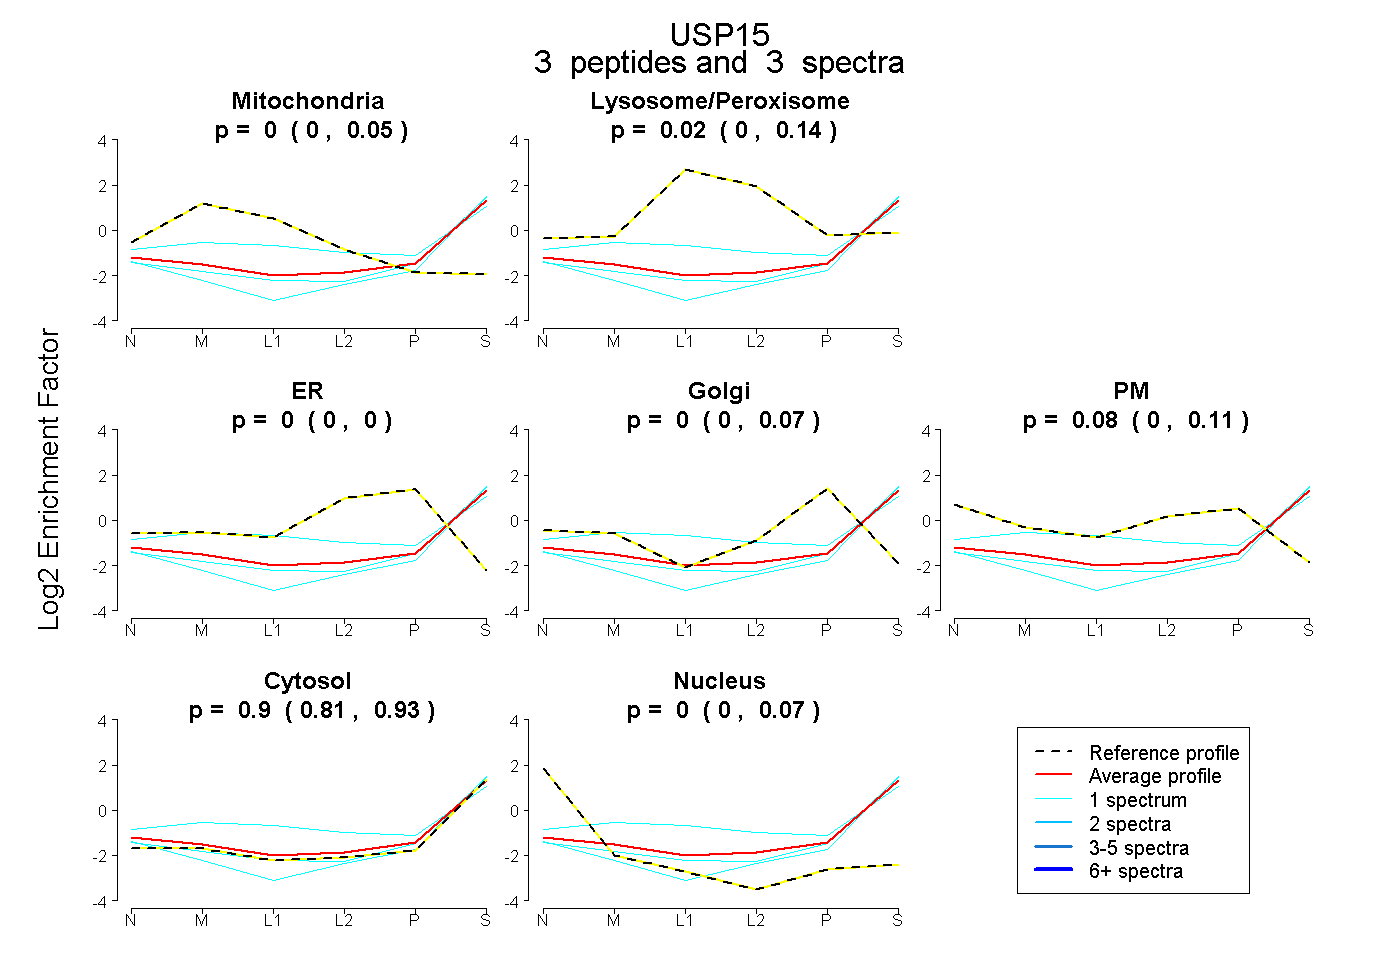
0.000 | 0.054
0.000 | 0.139
0.000 | 0.000
0.000 | 0.070
0.000 | 0.108
0.806 | 0.928
0.000 | 0.066
13peptides
spectra
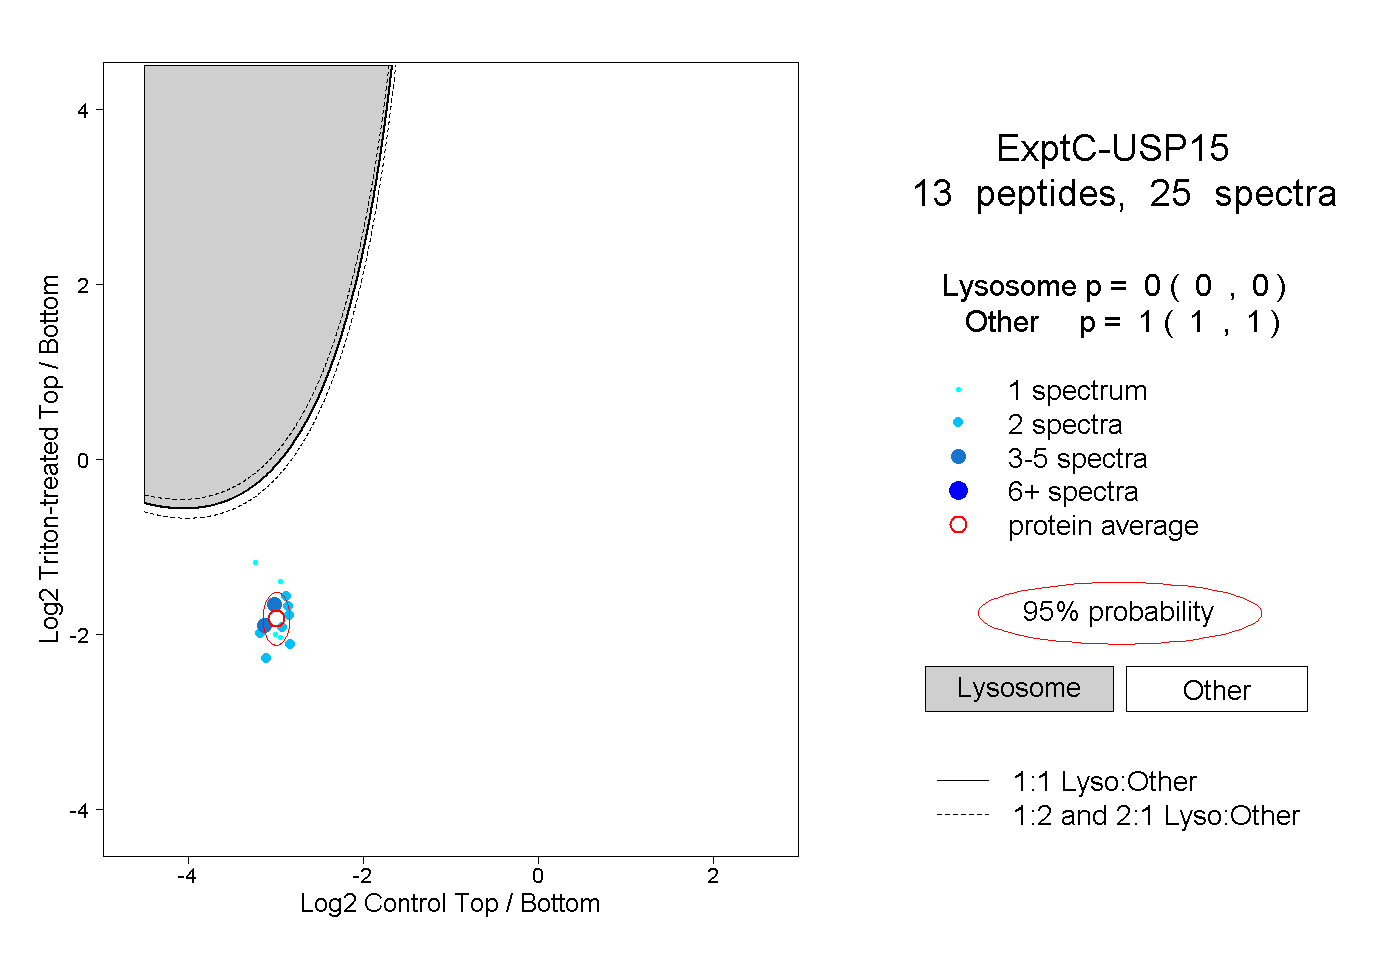
0.000 | 0.000
1.000 | 1.000