USP15
[ENSRNOP00000034485]
Main page
| | | Plot |
Mito |
Lyso |
|
Perox |
ER |
Golgi |
PM |
Cytosol |
Nucleus |
|
| Expt A |
 17
17
peptides |
39
spectra |
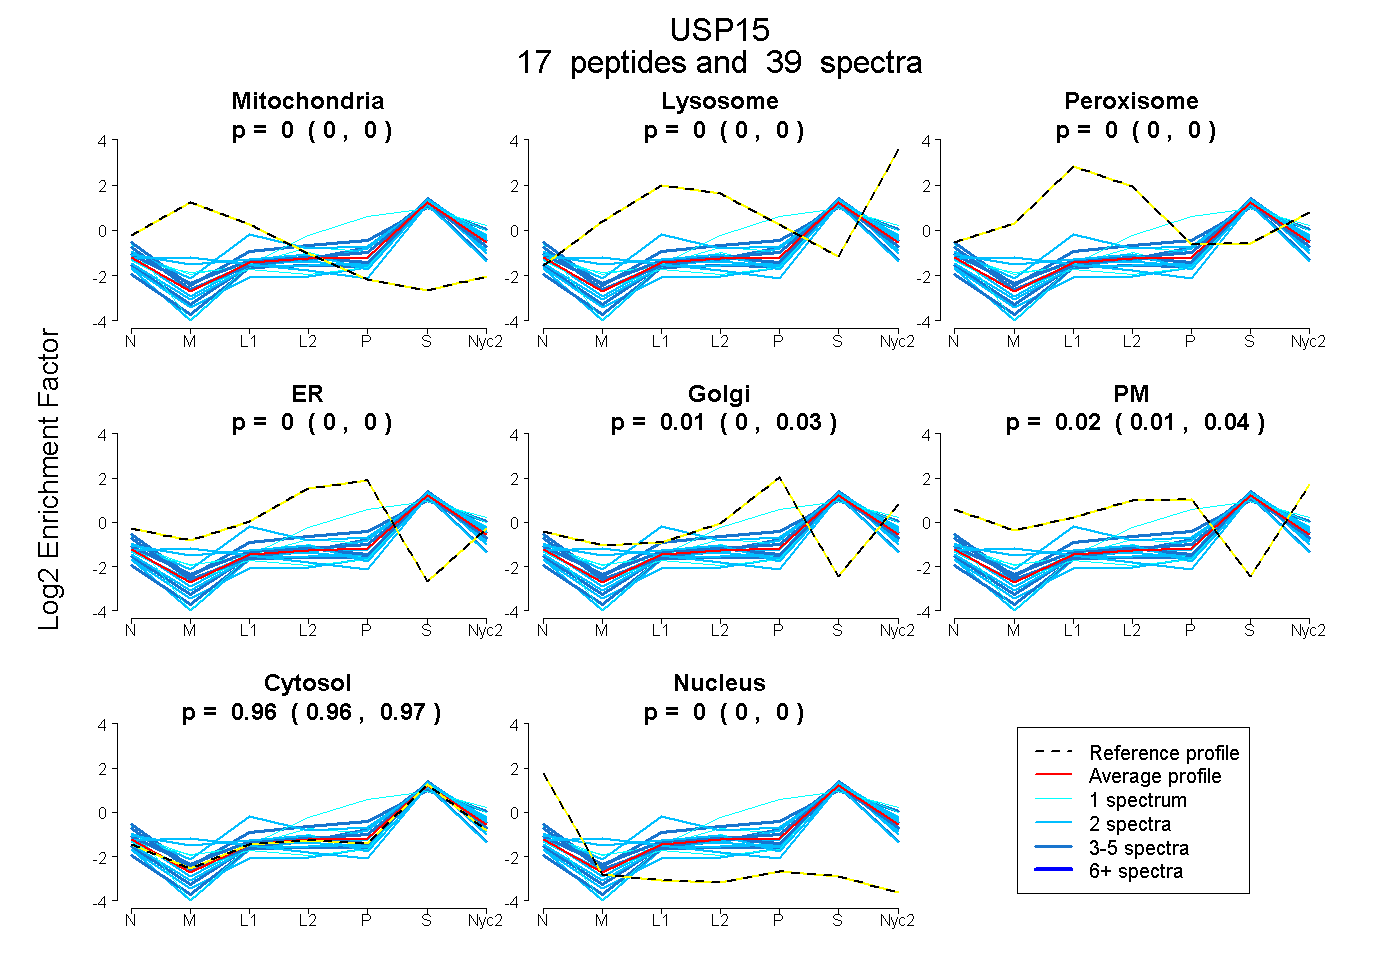 |
0.000
0.000 | 0.000 |
0.000
0.000 | 0.000 |
|
0.000
0.000 | 0.000 |
0.000
0.000 | 0.000 |
0.013
0.000 | 0.029 |
0.023
0.006 | 0.035 |
0.964
0.958 | 0.969 |
0.000
0.000 | 0.000 |
|
| | | Plot |
Mito |
|
Lyso or Perox |
|
ER |
Golgi |
PM |
Cytosol |
Nucleus |
|
| Expt B |
3
peptides |
3
spectra |
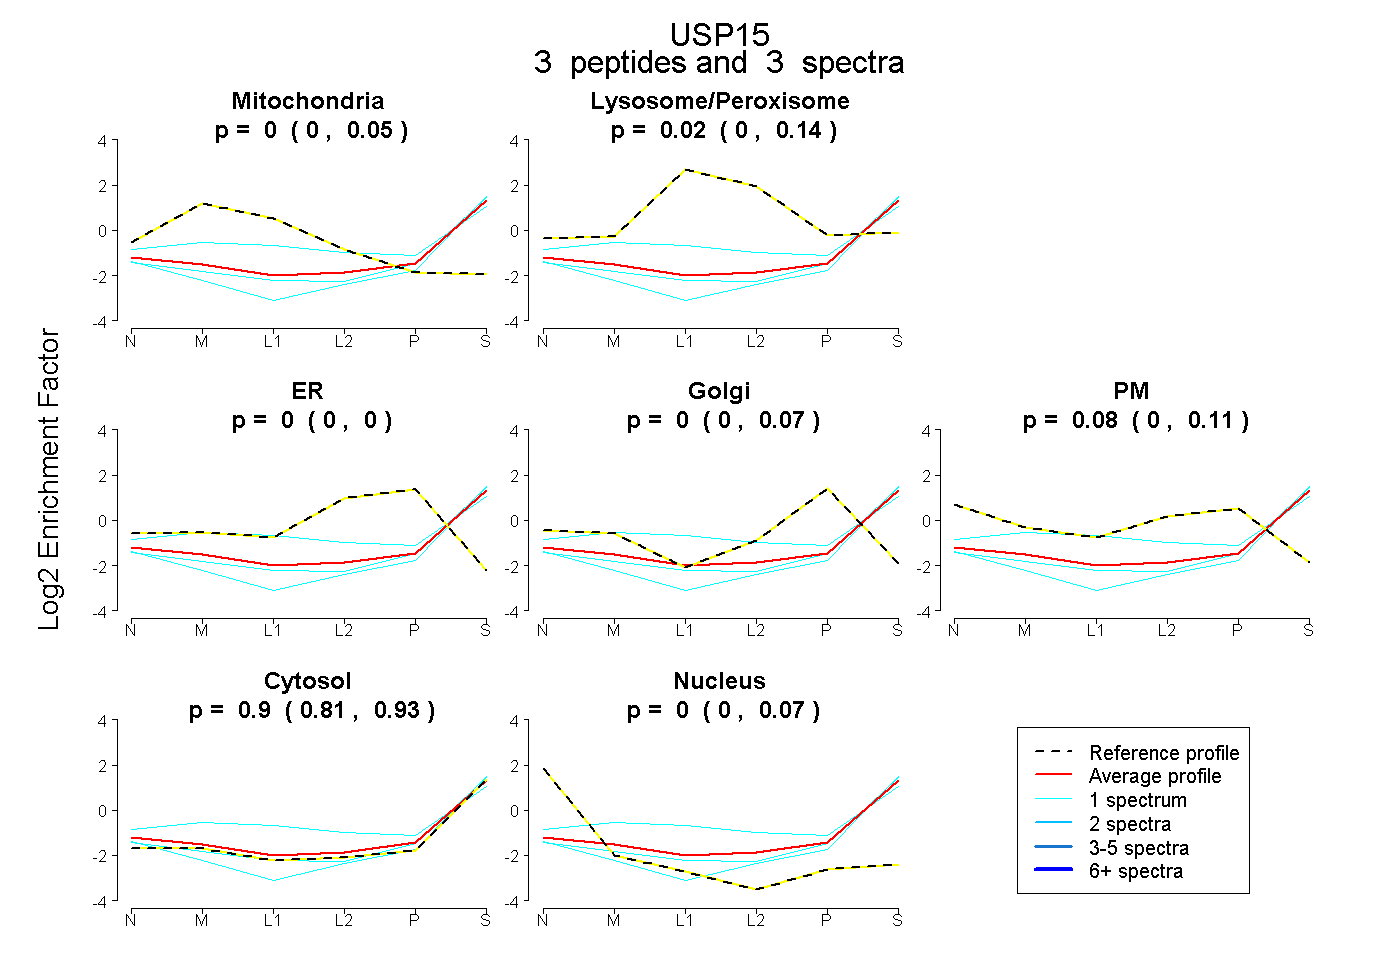 |
0.000
0.000 | 0.054 |
|
0.022
0.000 | 0.139 |
|
0.000
0.000 | 0.000 |
0.000
0.000 | 0.070 |
0.078
0.000 | 0.108 |
0.898
0.806 | 0.928 |
0.002
0.000 | 0.066 |
|
| 1 spectrum, MIVTDIYNHR |
0.090 |
|
0.262 |
|
0.000 |
0.000 |
0.031 |
0.618 |
0.000 |
|
| 1 spectrum, AAYVLFYQR |
0.000 |
|
0.000 |
|
0.000 |
0.019 |
0.000 |
0.959 |
0.022 |
|
| 1 spectrum, SLEVYLVR |
0.000 |
|
0.000 |
|
0.000 |
0.000 |
0.000 |
0.944 |
0.056 |
|
| | | Plot |
|
Lyso |
|
|
|
|
|
|
|
Other |
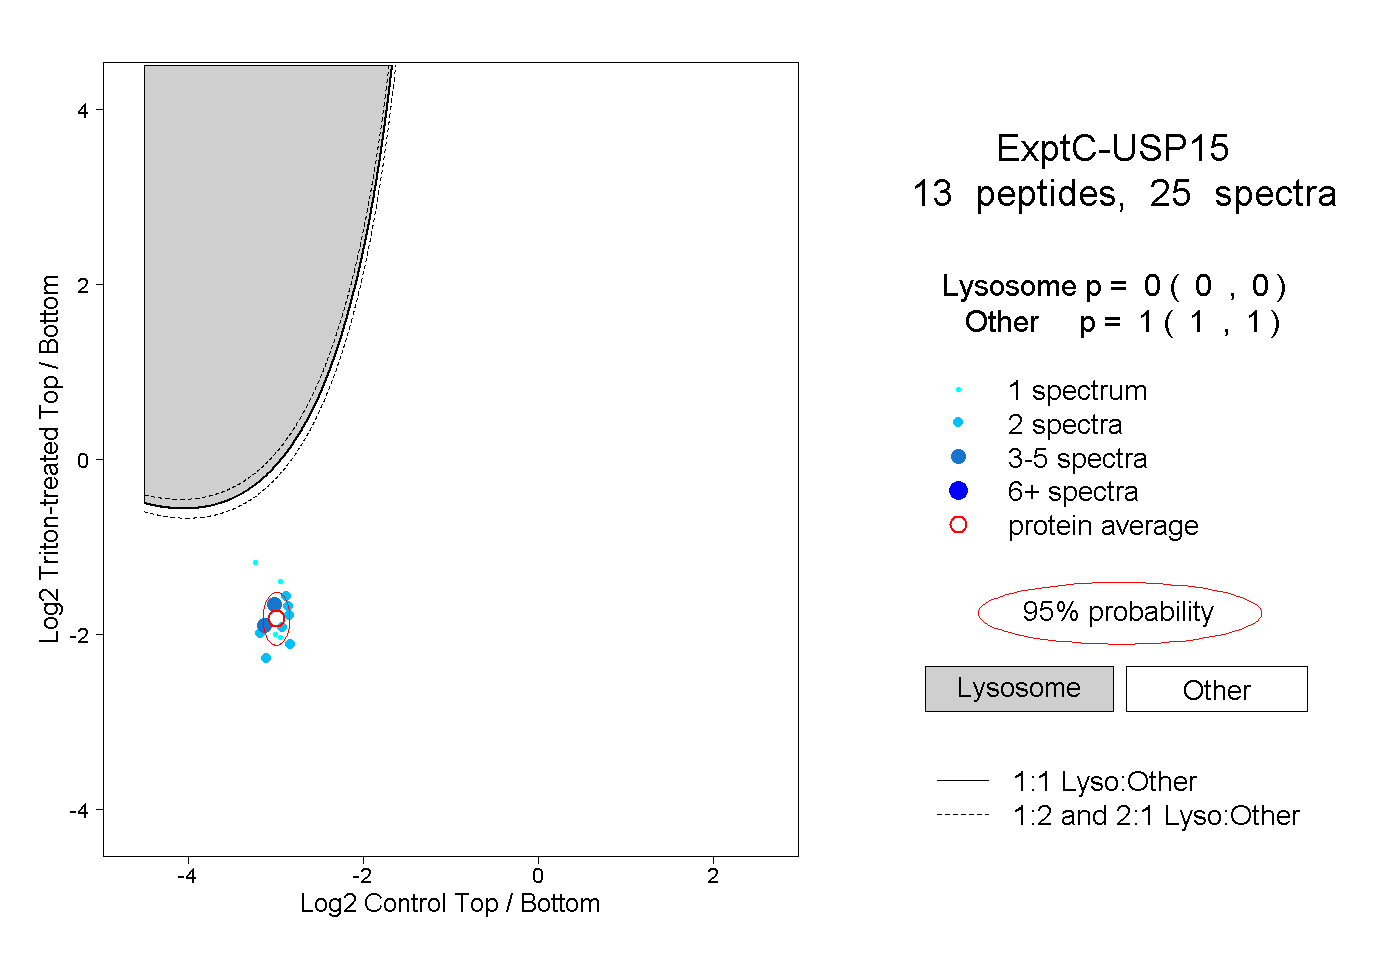
| Expt C |
13
peptides |
25
spectra |
 |
|
0.000
0.000 | 0.000 |
|
|
|
|
|
|
|
1.000
1.000 | 1.000 |