 1
1peptide
spectra
0.132 | 0.181
0.182 | 0.302
0.000 | 0.076
0.000 | 0.000
0.000 | 0.000
0.319 | 0.410
0.171 | 0.213
0.000 | 0.000
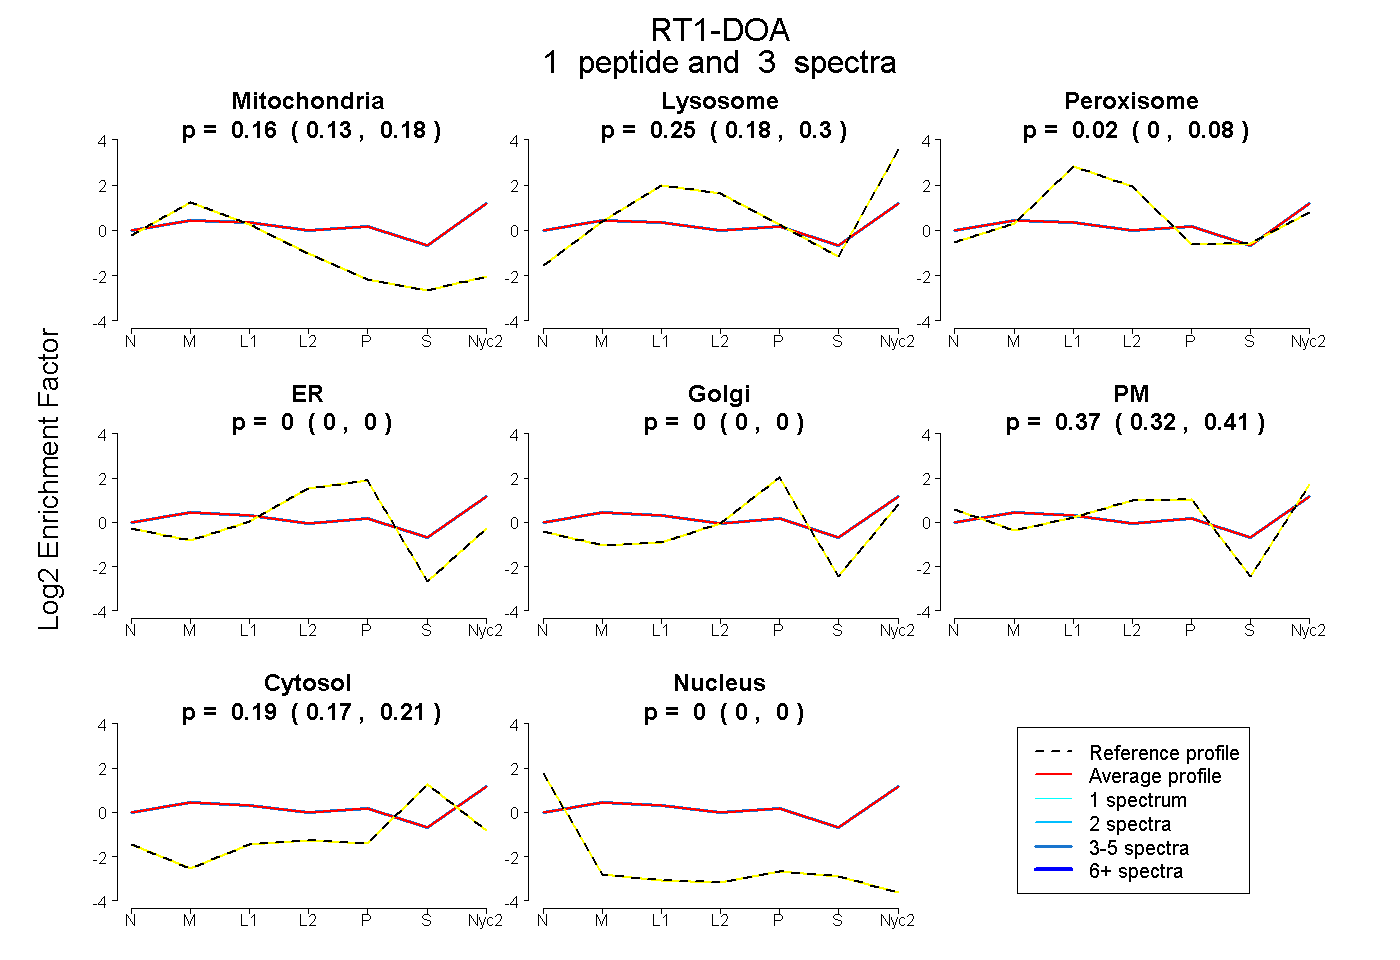
| Plot | Mito | Lyso | Perox | ER | Golgi | PM | Cytosol | Nucleus | |||||
| Expt A |
1 peptide |
3 spectra |
|
0.160 0.132 | 0.181 |
0.252 0.182 | 0.302 |
0.024 0.000 | 0.076 |
0.000 0.000 | 0.000 |
0.000 0.000 | 0.000 |
0.371 0.319 | 0.410 |
0.193 0.171 | 0.213 |
0.000 0.000 | 0.000 |
| 3 spectra, GVTQTSFYSQPNHR | 0.160 | 0.252 | 0.024 | 0.000 | 0.000 | 0.371 | 0.193 | 0.000 |
| Plot | Lyso | Other | |||||||||||
| Expt C |
3 peptides |
10 spectra |
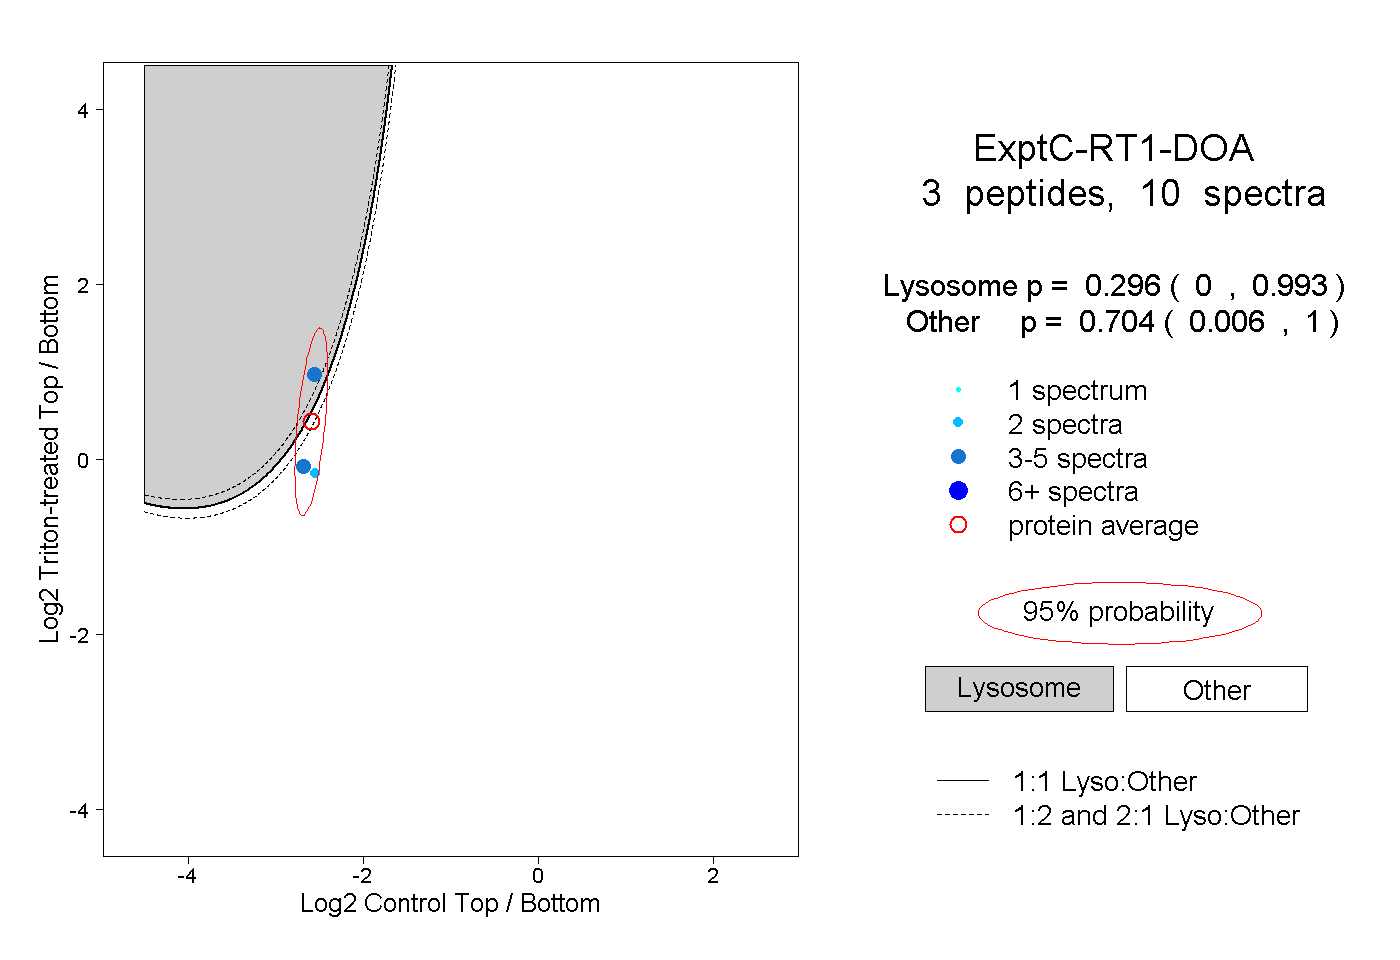 |
0.296 0.000 | 0.993 |
0.704 0.006 | 1.000 |