 1
1peptide
spectra
0.000 | 0.139
0.000 | 0.256
0.000 | 0.241
0.000 | 0.548
0.000 | 0.405
0.000 | 0.289
0.000 | 0.509
0.000 | 0.189
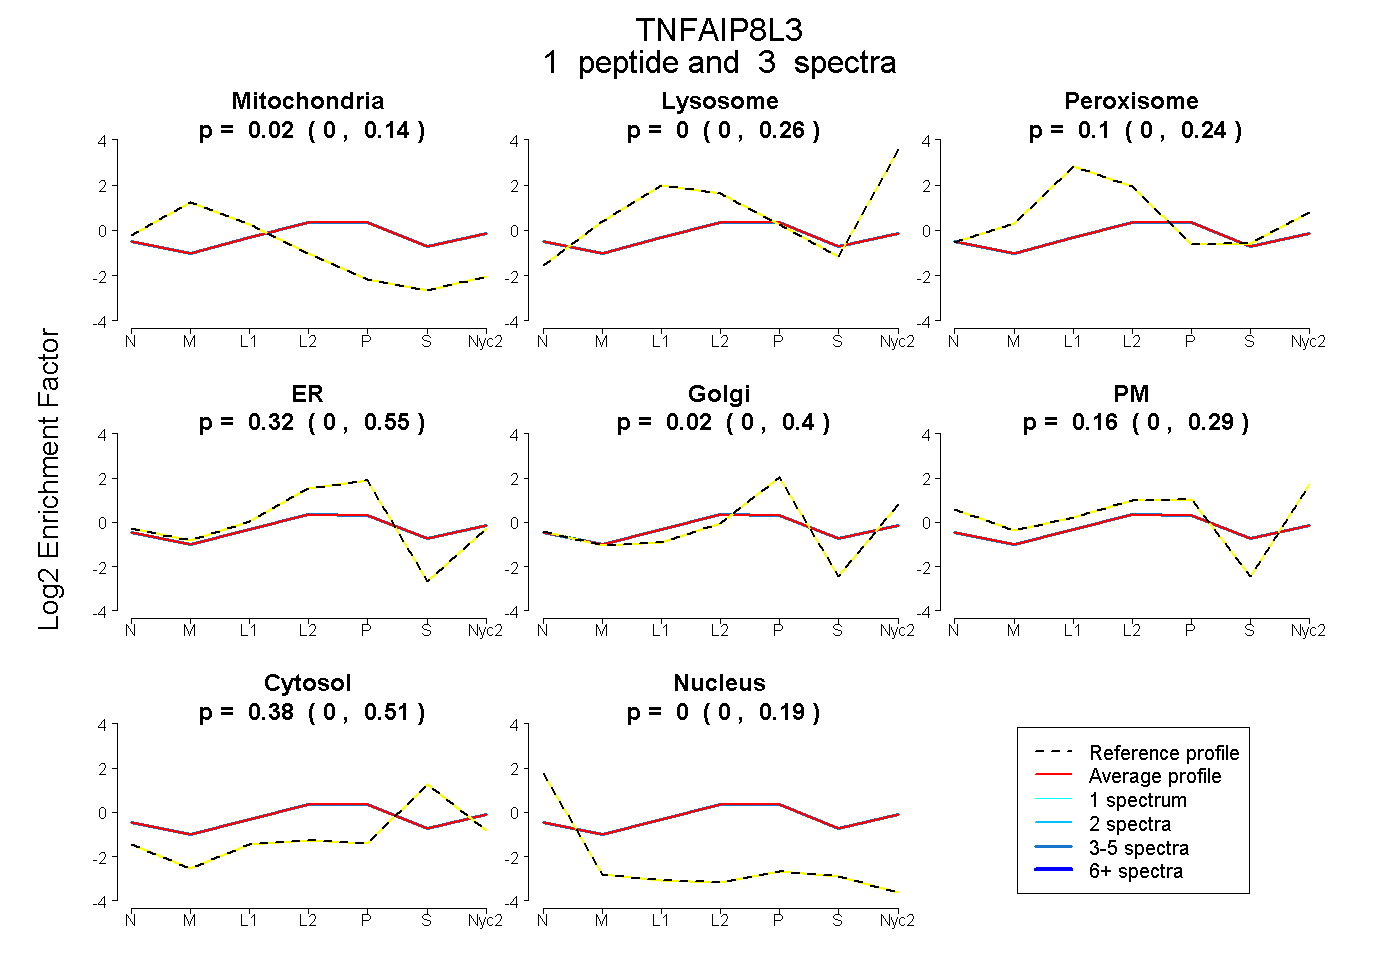
| Plot | Mito | Lyso | Perox | ER | Golgi | PM | Cytosol | Nucleus | |||||
| Expt A |
1 peptide |
3 spectra |
|
0.018 0.000 | 0.139 |
0.000 0.000 | 0.256 |
0.099 0.000 | 0.241 |
0.318 0.000 | 0.548 |
0.023 0.000 | 0.405 |
0.165 0.000 | 0.289 |
0.377 0.000 | 0.509 |
0.000 0.000 | 0.189 |