 6
6peptides
spectra
0.000 | 0.000
0.084 | 0.156
0.000 | 0.000
0.000 | 0.001
0.215 | 0.303
0.557 | 0.662
0.000 | 0.000
0.000 | 0.000
4peptides
spectra
0.000 | 0.000
1.000 | 1.000
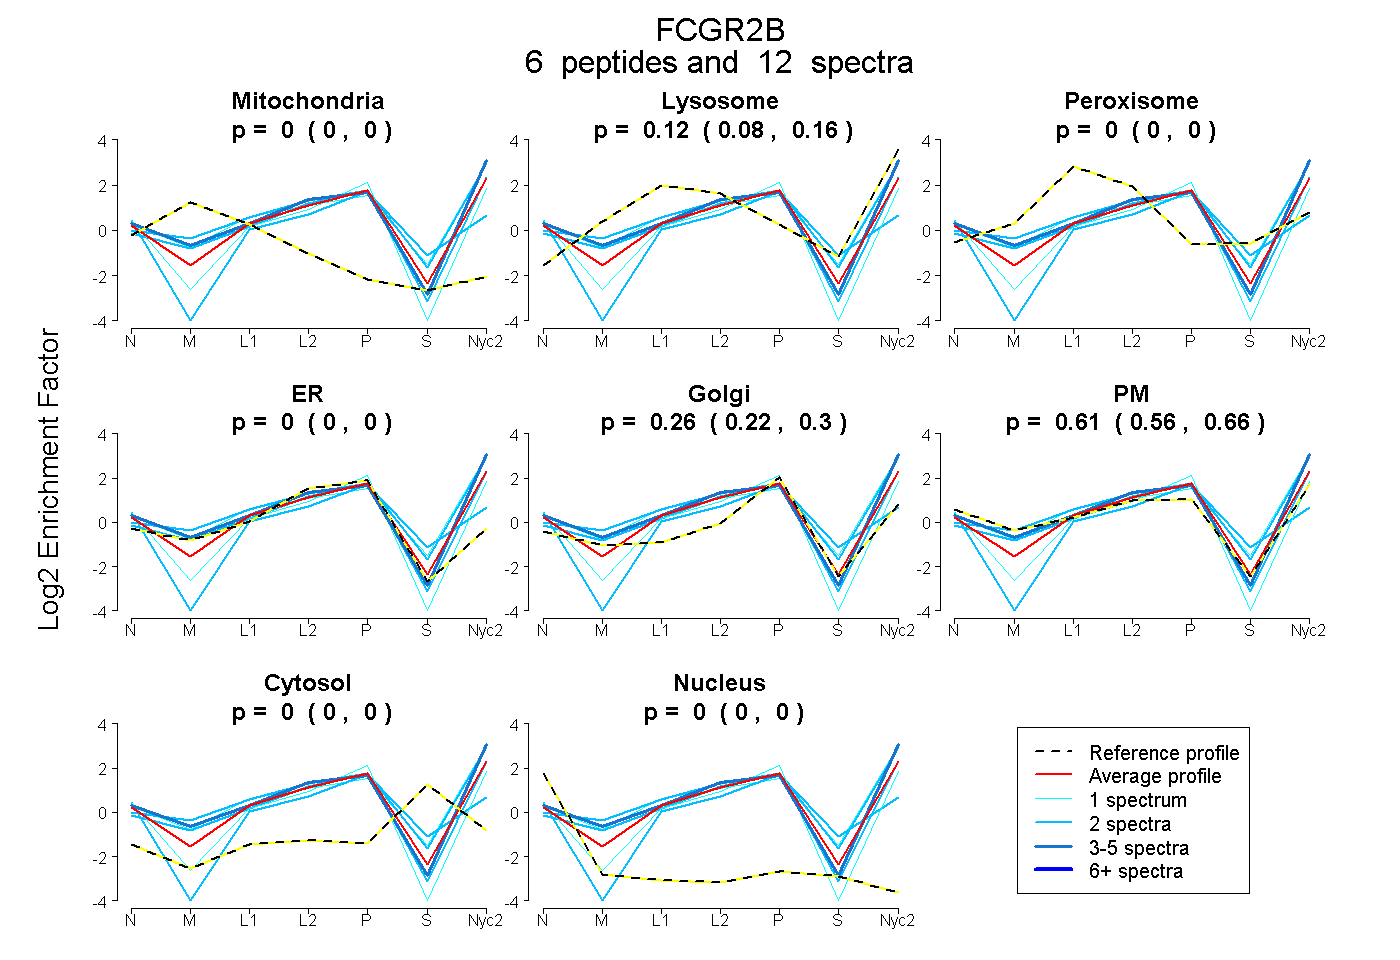
| Plot | Mito | Lyso | Perox | ER | Golgi | PM | Cytosol | Nucleus | |||||
| Expt A |
6 peptides |
12 spectra |
|
0.000 0.000 | 0.000 |
0.122 0.084 | 0.156 |
0.000 0.000 | 0.000 |
0.000 0.000 | 0.001 |
0.264 0.215 | 0.303 |
0.614 0.557 | 0.662 |
0.000 0.000 | 0.000 |
0.000 0.000 | 0.000 |
||
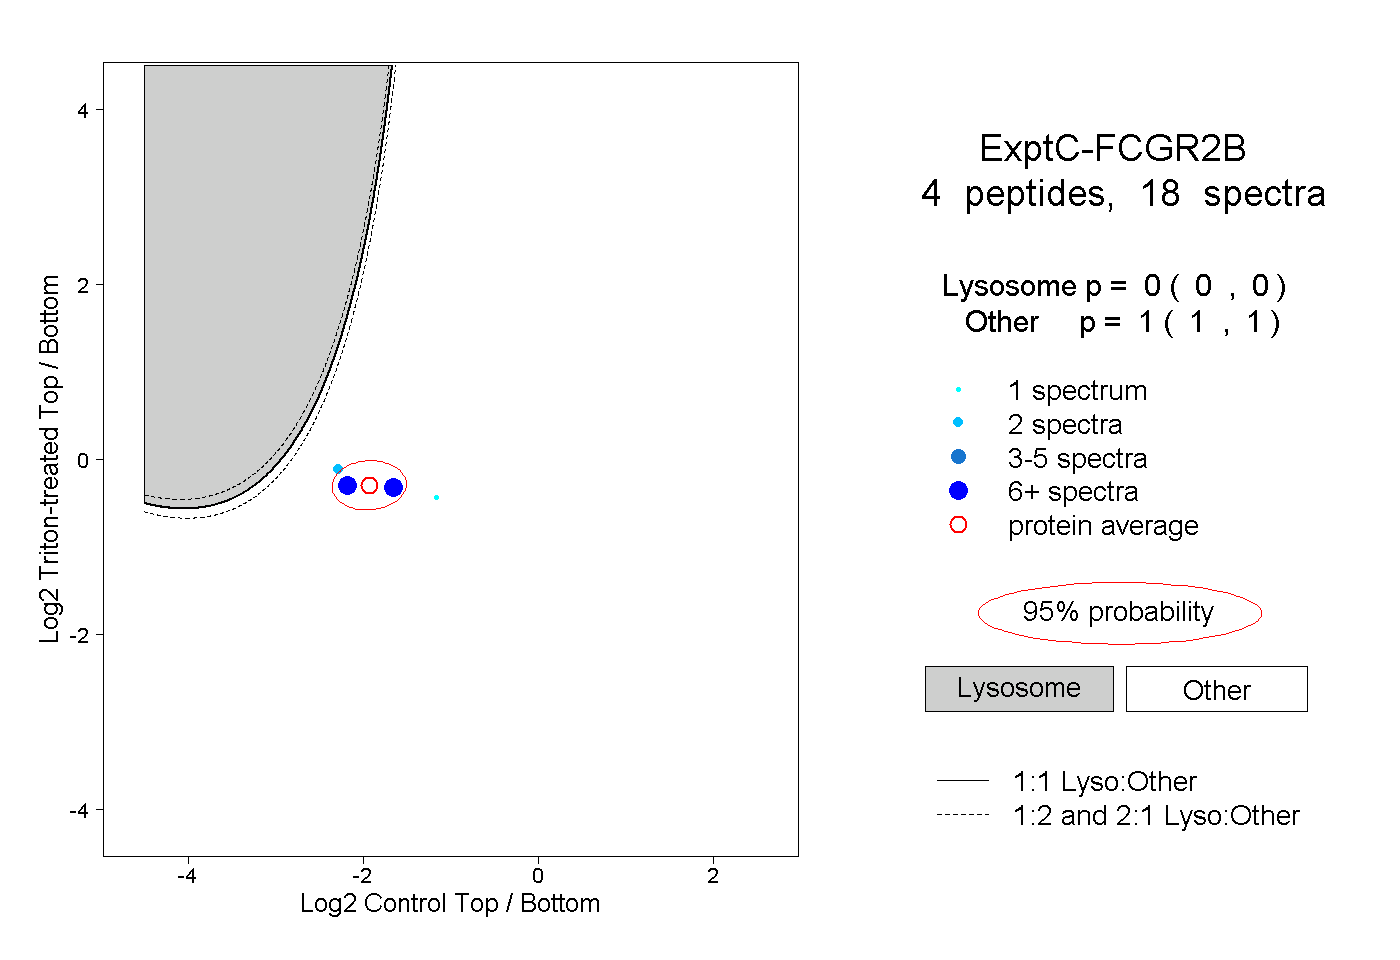
| Plot | Lyso | Other | |||||||||||
| Expt C |
4 peptides |
18 spectra |
|
0.000 0.000 | 0.000 |
1.000 1.000 | 1.000 |