6
6peptides
spectra
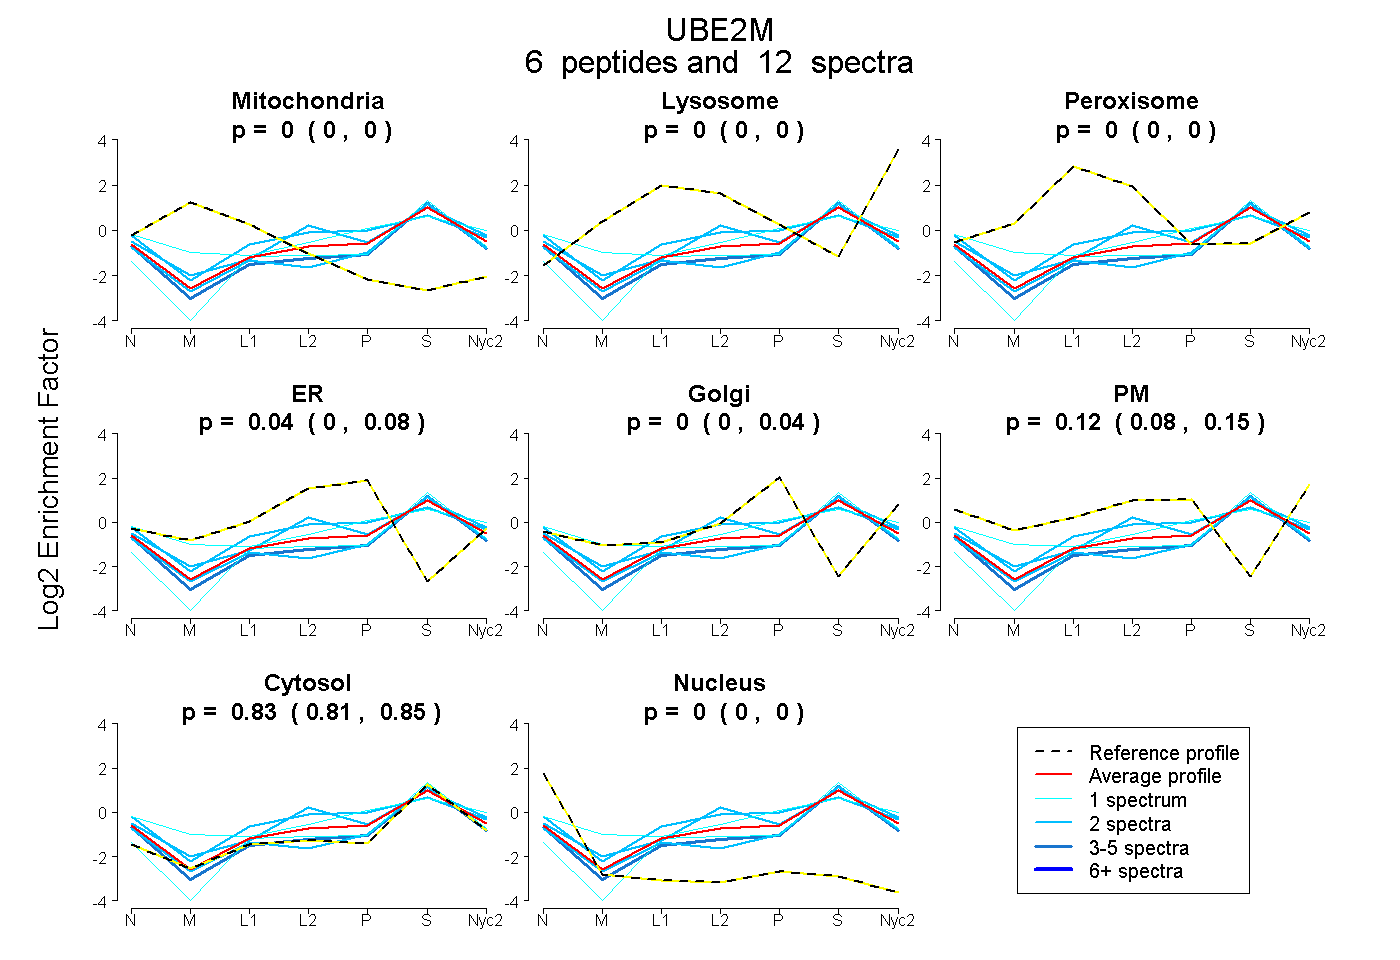
0.000 | 0.000
0.000 | 0.000
0.000 | 0.000
0.000 | 0.079
0.000 | 0.036
0.079 | 0.155
0.813 | 0.847
0.000 | 0.002
4peptides
spectra
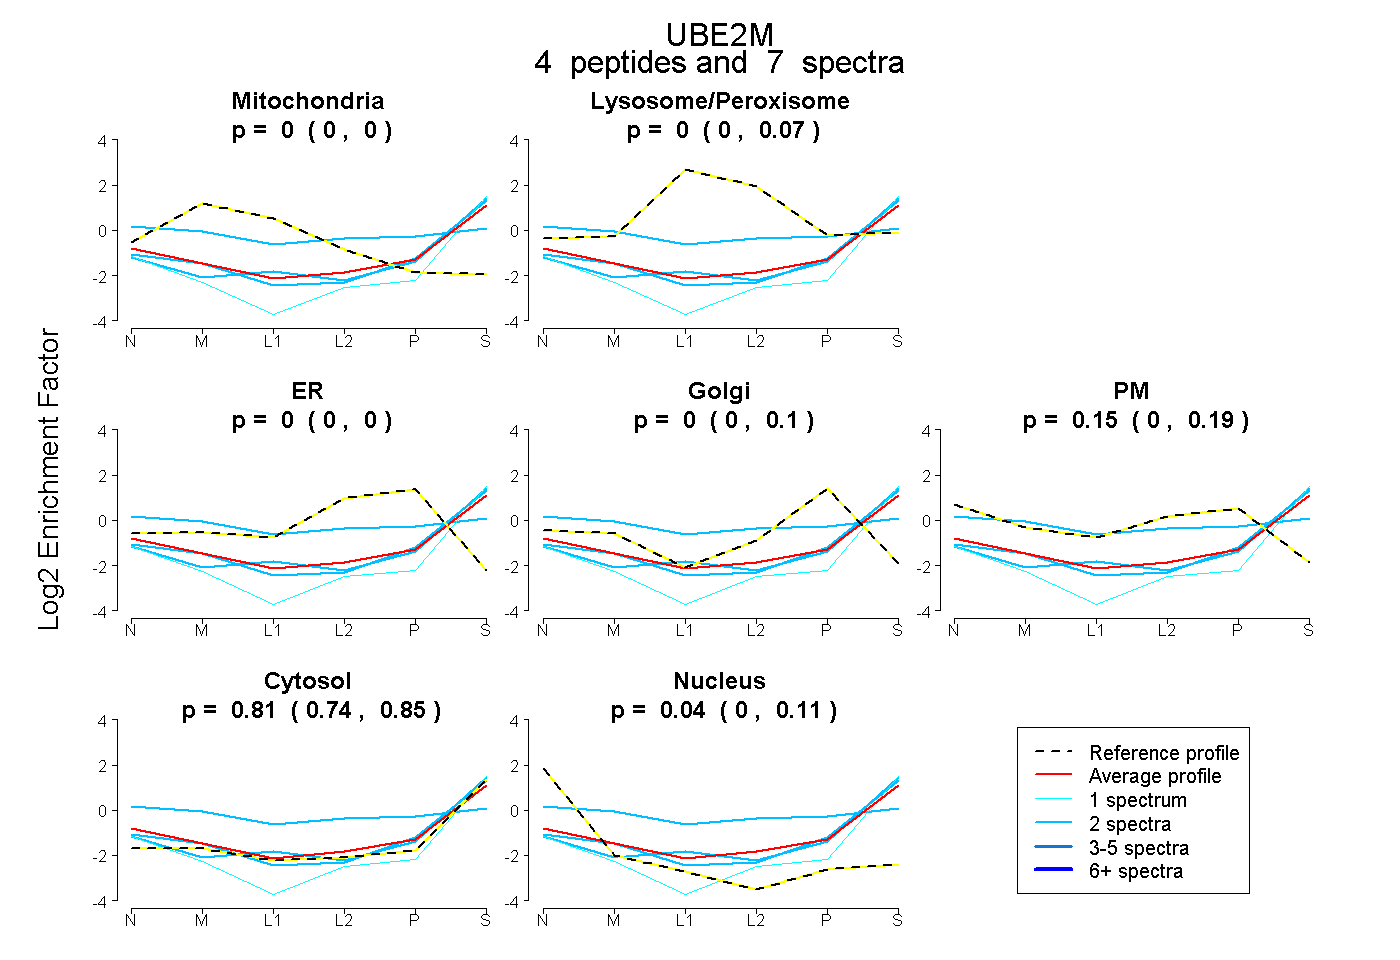
0.000 | 0.000
0.000 | 0.075
0.000 | 0.000
0.000 | 0.097
0.000 | 0.192
0.738 | 0.846
0.000 | 0.110