 6
6peptides
spectra
0.000 | 0.000
0.000 | 0.000
0.000 | 0.000
0.000 | 0.079
0.000 | 0.036
0.079 | 0.155
0.813 | 0.847
0.000 | 0.002
| Plot | Mito | Lyso | Perox | ER | Golgi | PM | Cytosol | Nucleus | |||||
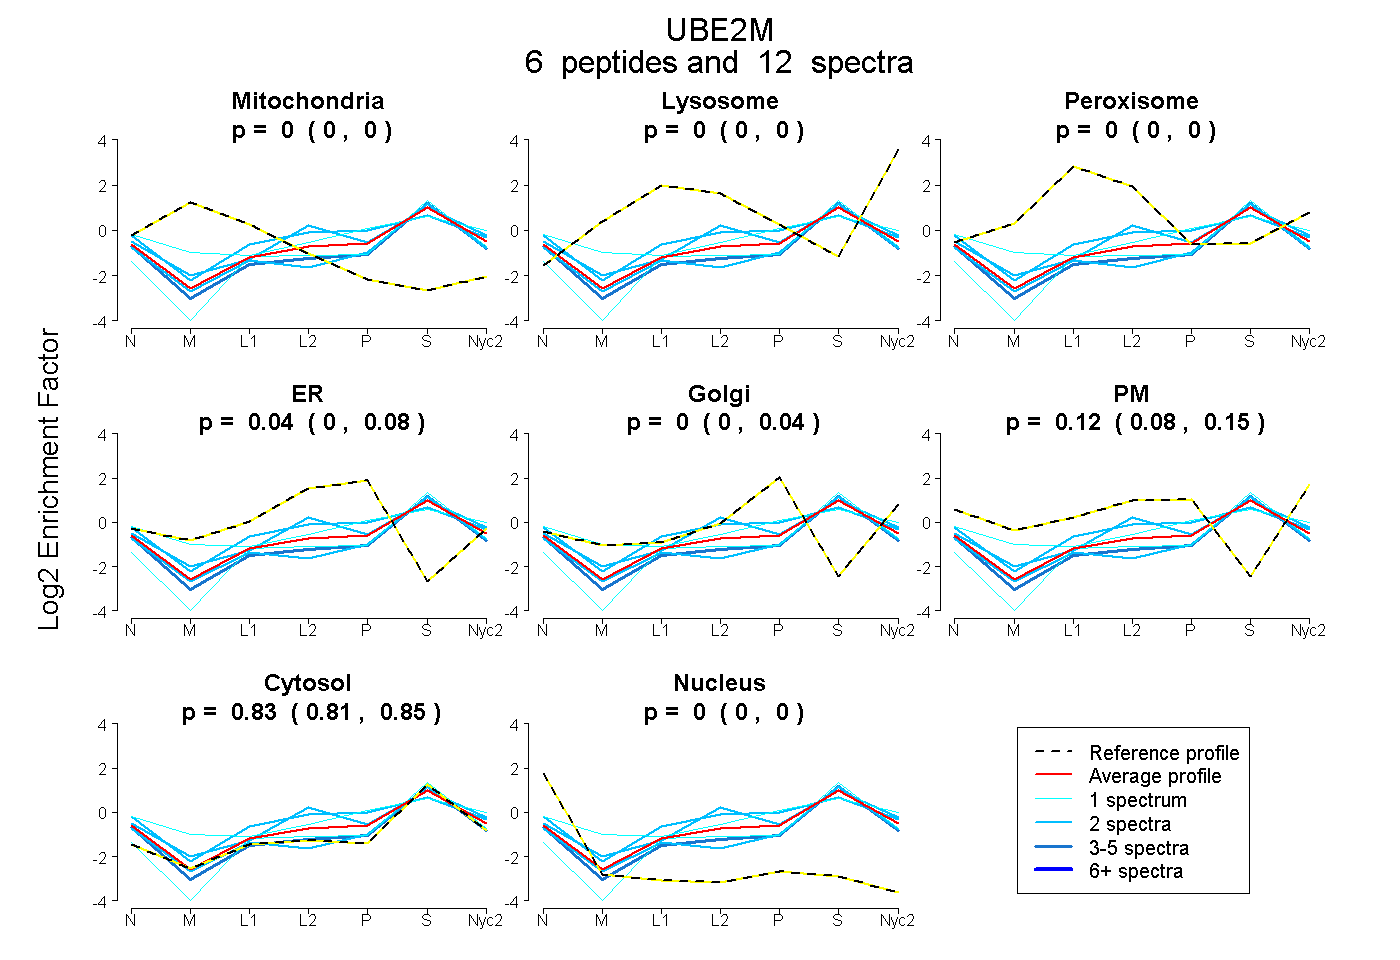
| Expt A |
6 peptides |
12 spectra |
|
0.000 0.000 | 0.000 |
0.000 0.000 | 0.000 |
0.000 0.000 | 0.000 |
0.044 0.000 | 0.079 |
0.000 0.000 | 0.036 |
0.123 0.079 | 0.155 |
0.833 0.813 | 0.847 |
0.000 0.000 | 0.002 |
| 1 spectrum, VGQGYPHDPPK | 0.000 | 0.000 | 0.000 | 0.000 | 0.039 | 0.345 | 0.617 | 0.000 | ||
| 2 spectra, LFEQNVQR | 0.000 | 0.000 | 0.048 | 0.058 | 0.000 | 0.172 | 0.722 | 0.000 | ||
| 4 spectra, FVFSFK | 0.000 | 0.000 | 0.000 | 0.000 | 0.015 | 0.019 | 0.917 | 0.049 | ||
| 2 spectra, EAAEVLQNNR | 0.000 | 0.000 | 0.048 | 0.159 | 0.000 | 0.145 | 0.648 | 0.000 | ||
| 2 spectra, GGYIGSTYFER | 0.000 | 0.000 | 0.000 | 0.000 | 0.047 | 0.000 | 0.904 | 0.050 | ||
| 1 spectrum, LVICPDEGFYK | 0.000 | 0.000 | 0.000 | 0.000 | 0.000 | 0.000 | 1.000 | 0.000 |
| Plot | Mito | Lyso or Perox | ER | Golgi | PM | Cytosol | Nucleus | ||||||
| Expt B |
4 peptides |
7 spectra |
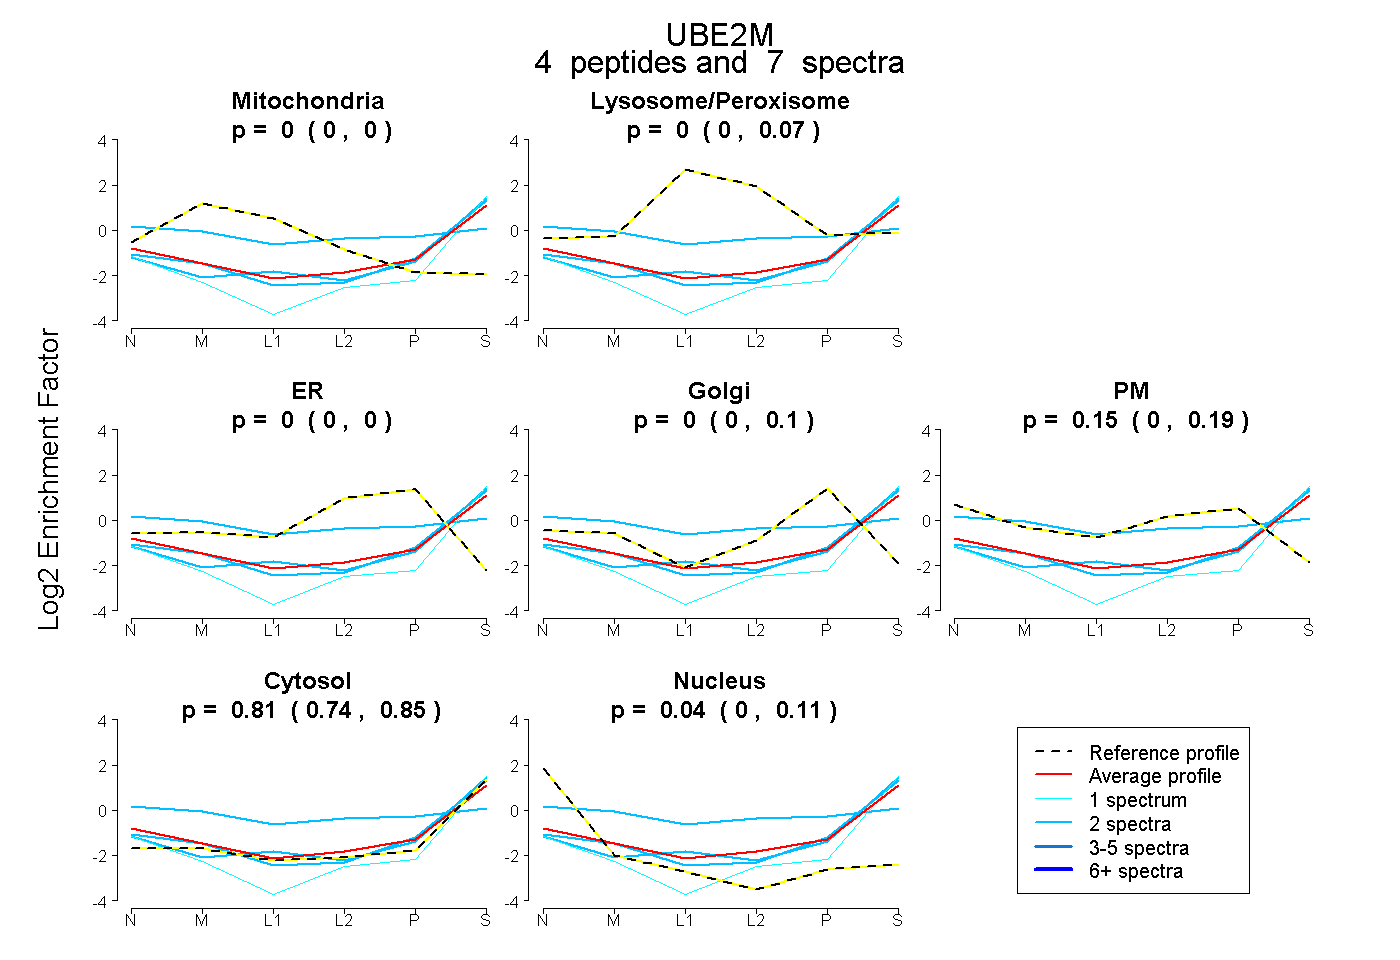 |
0.000 0.000 | 0.000 |
0.000 0.000 | 0.075 |
0.000 0.000 | 0.000 |
0.000 0.000 | 0.097 |
0.150 0.000 | 0.192 |
0.808 0.738 | 0.846 |
0.042 0.000 | 0.110 |
|||
| Plot | Lyso | Other | |||||||||||
| Expt C |
5 peptides |
24 spectra |
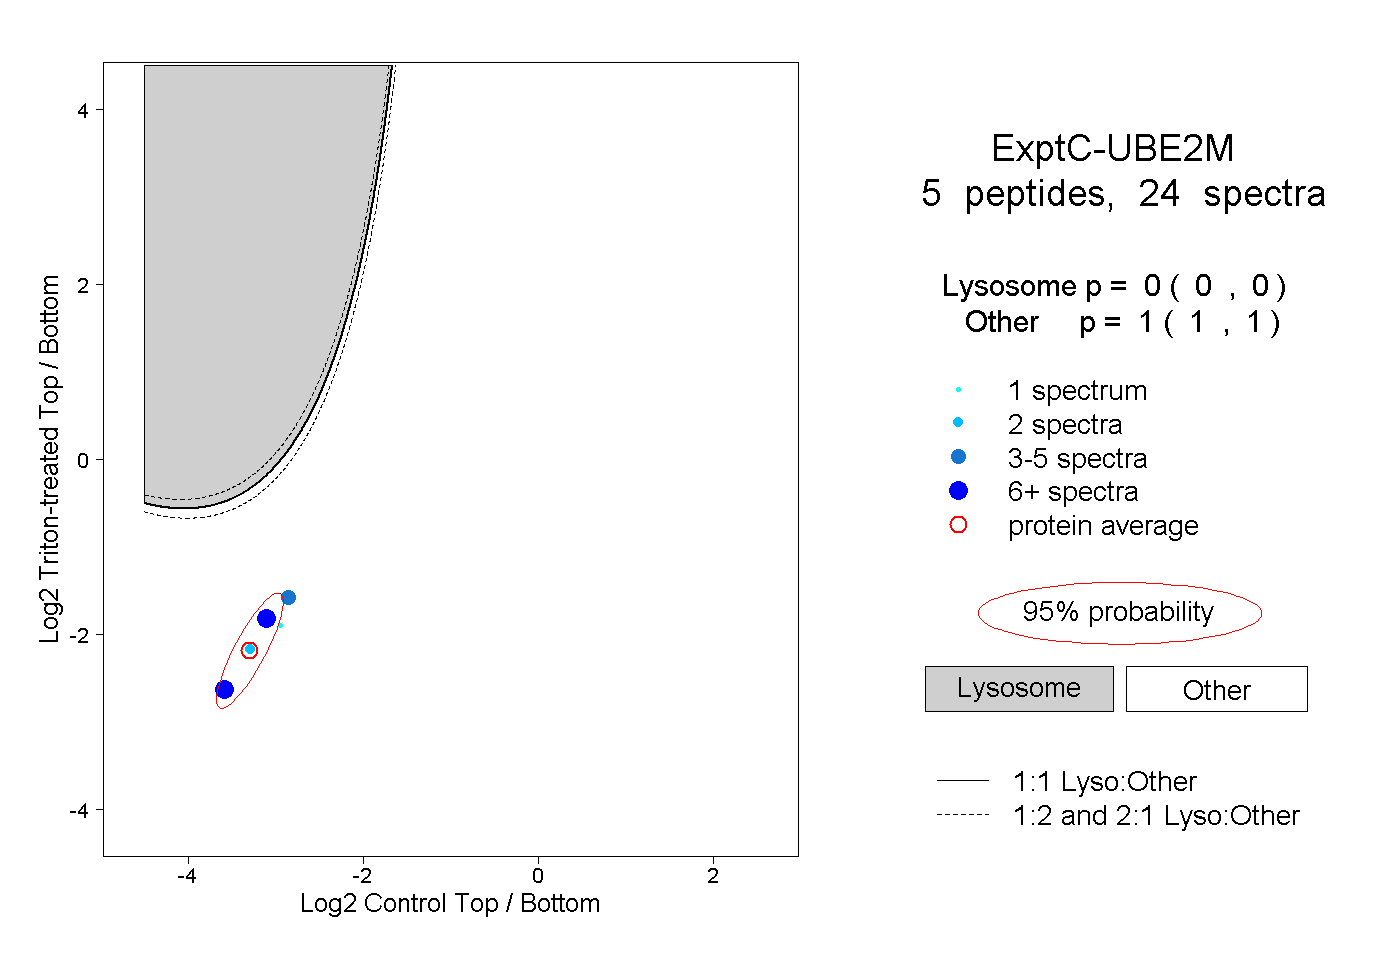 |
0.000 0.000 | 0.000 |
1.000 1.000 | 1.000 |
||||||||
| Plot | Lyso | Other | |||||||||||
| Expt D |
1 peptide |
1 spectrum |
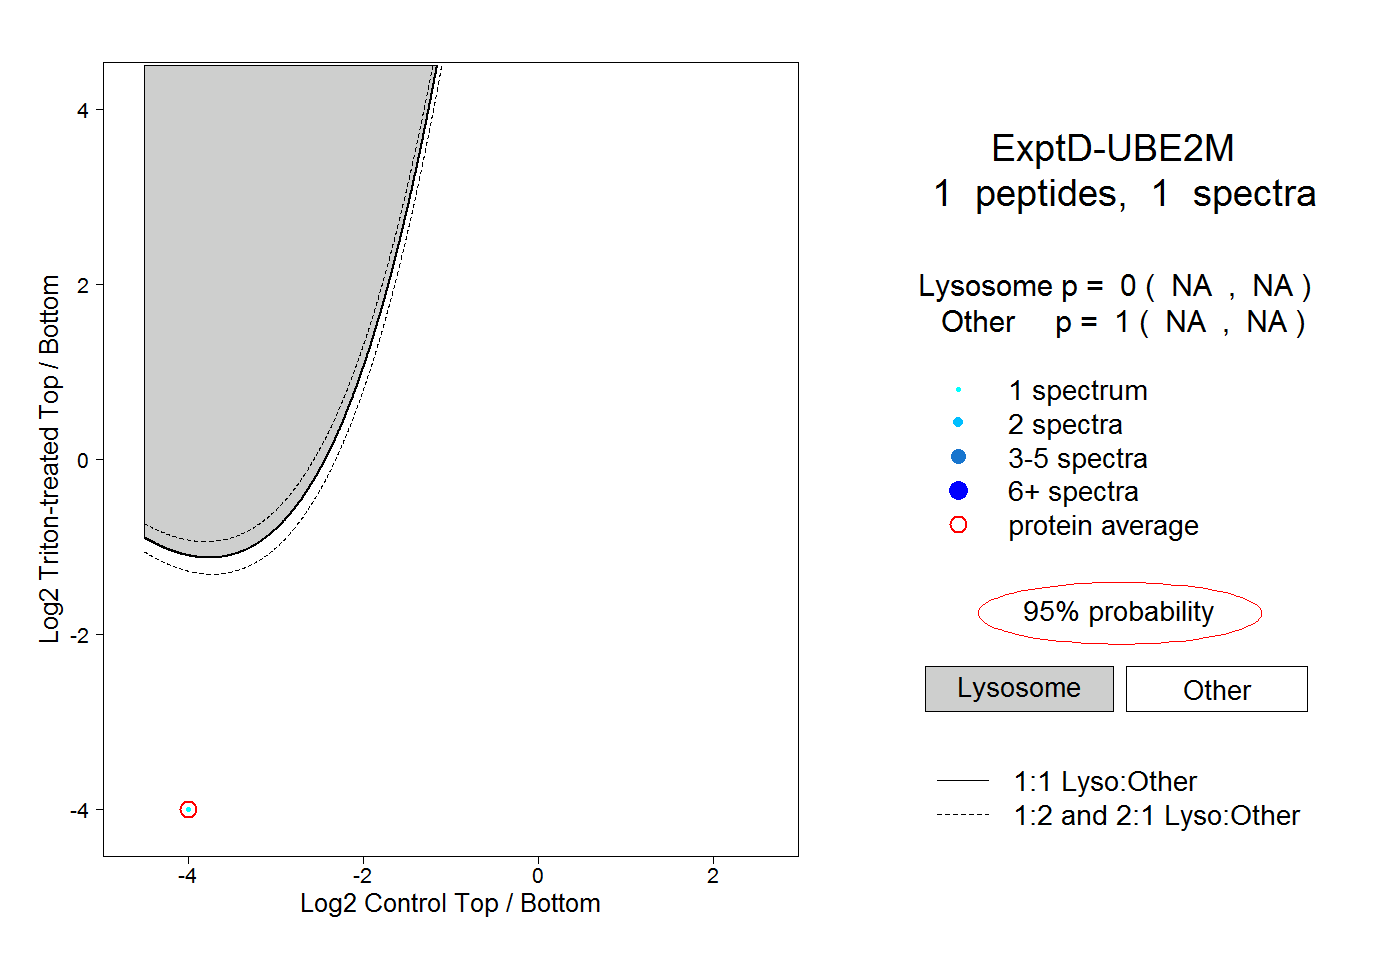 |
0.000 NA | NA |
1.000 NA | NA |