 4
4peptides
spectra
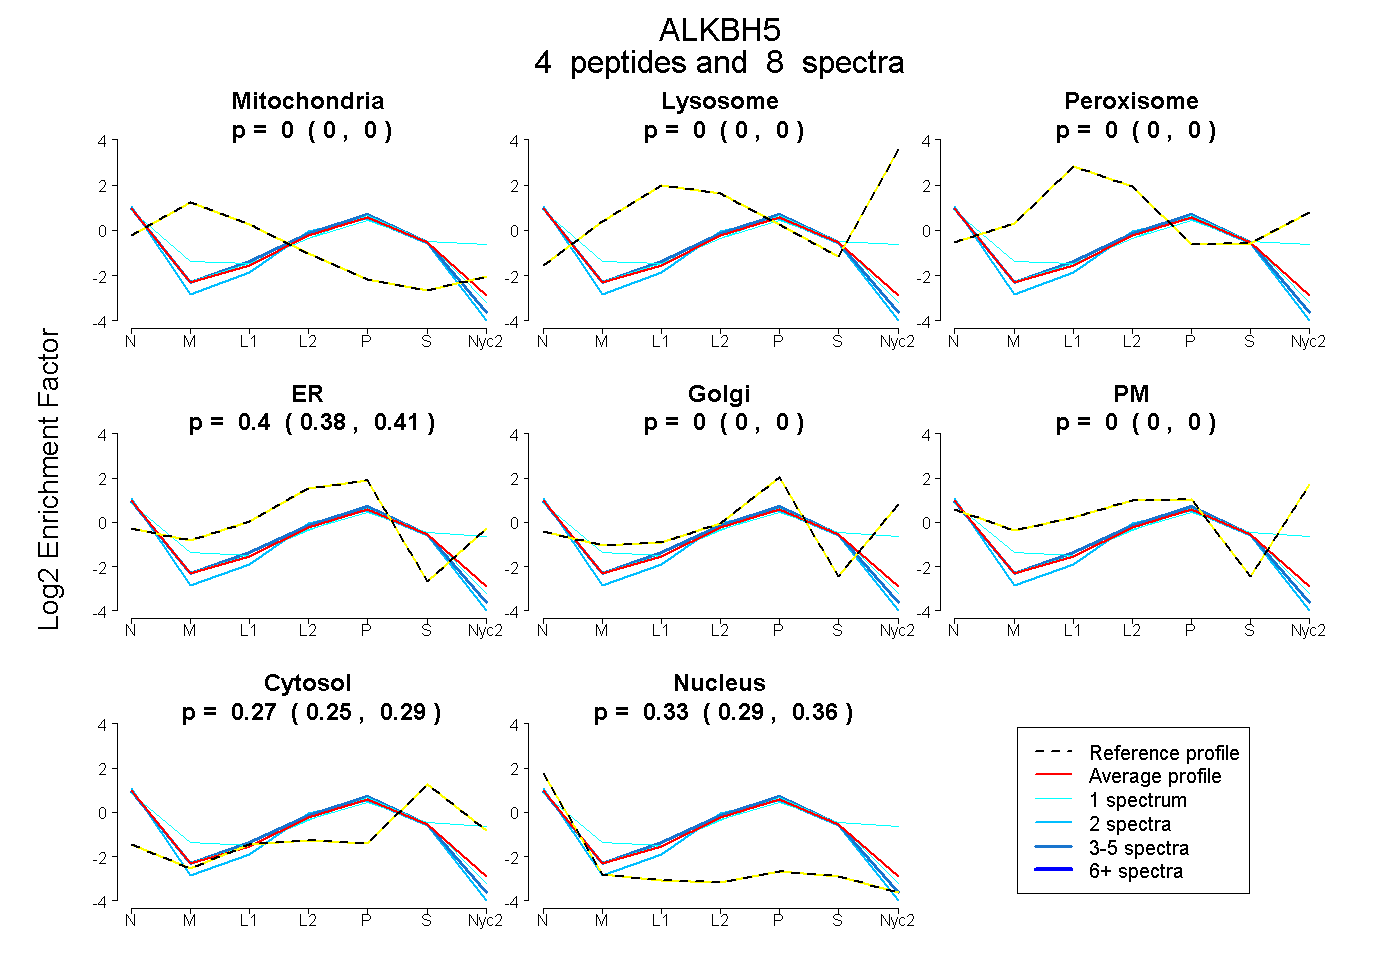
0.000 | 0.000
0.000 | 0.000
0.000 | 0.000
0.384 | 0.413
0.000 | 0.000
0.000 | 0.000
0.248 | 0.292
0.293 | 0.357
| Plot | Mito | Lyso | Perox | ER | Golgi | PM | Cytosol | Nucleus | |||||
| Expt A |
4 peptides |
8 spectra |
|
0.000 0.000 | 0.000 |
0.000 0.000 | 0.000 |
0.000 0.000 | 0.000 |
0.400 0.384 | 0.413 |
0.000 0.000 | 0.000 |
0.000 0.000 | 0.000 |
0.272 0.248 | 0.292 |
0.327 0.293 | 0.357 |
| 1 spectrum, LFSQDECSK | 0.000 | 0.000 | 0.000 | 0.136 | 0.107 | 0.255 | 0.336 | 0.165 | ||
| 4 spectra, FQFKPIR | 0.000 | 0.000 | 0.000 | 0.409 | 0.000 | 0.000 | 0.231 | 0.359 | ||
| 2 spectra, AVIILR | 0.000 | 0.000 | 0.000 | 0.349 | 0.000 | 0.000 | 0.223 | 0.428 | ||
| 1 spectrum, VSEPVLSLPVR | 0.000 | 0.000 | 0.000 | 0.387 | 0.000 | 0.000 | 0.268 | 0.346 |
| Plot | Lyso | Other | |||||||||||
| Expt C |
2 peptides |
4 spectra |
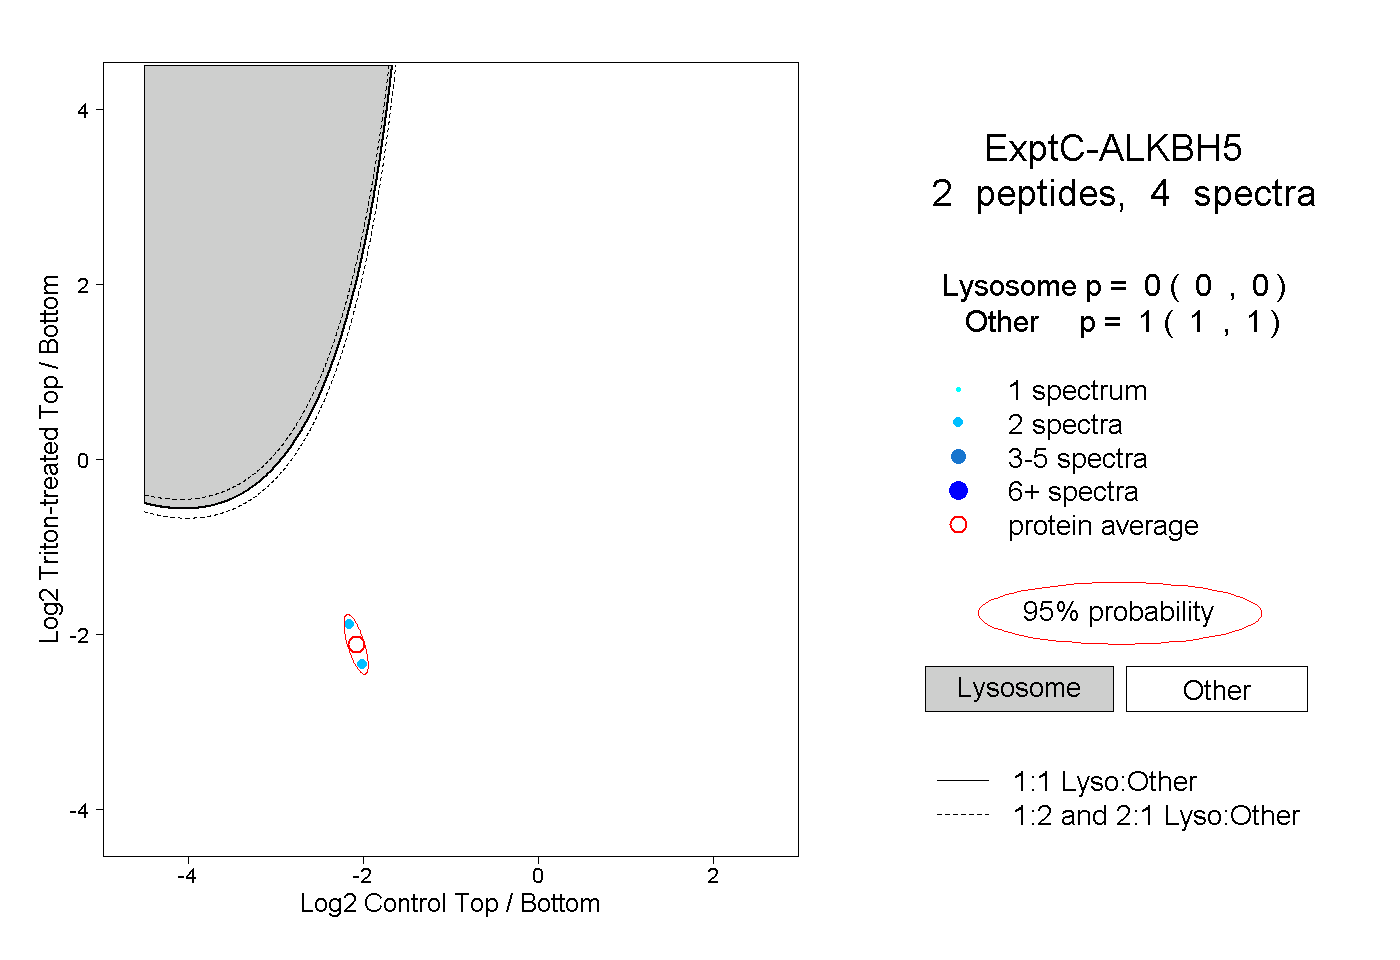 |
0.000 0.000 | 0.000 |
1.000 1.000 | 1.000 |