 4
4peptides
spectra
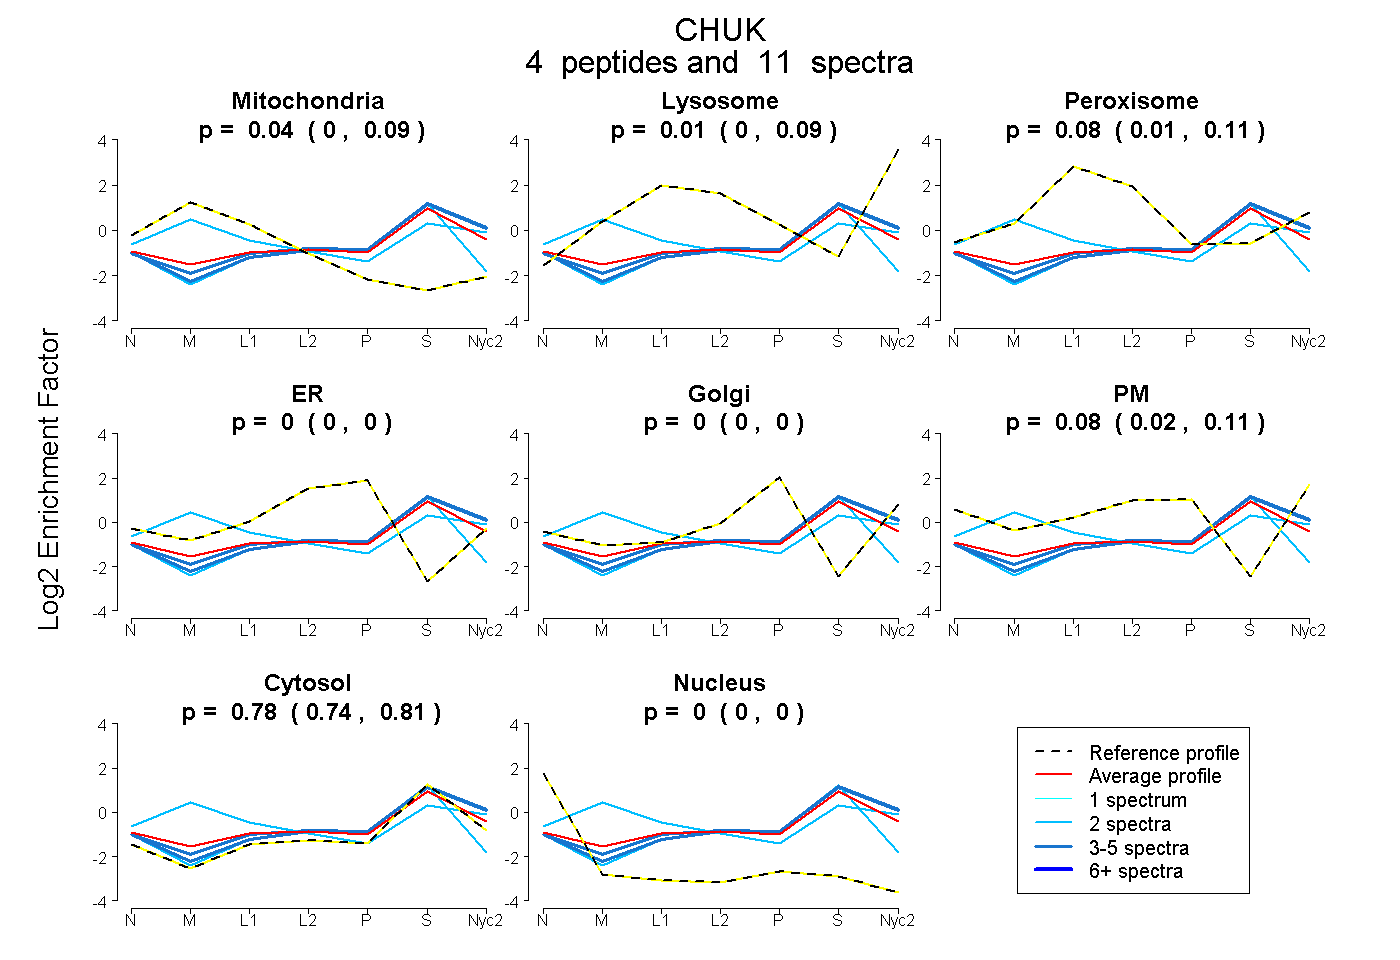
0.000 | 0.093
0.000 | 0.088
0.014 | 0.109
0.000 | 0.000
0.000 | 0.002
0.023 | 0.112
0.736 | 0.814
0.000 | 0.000
2peptides
spectra
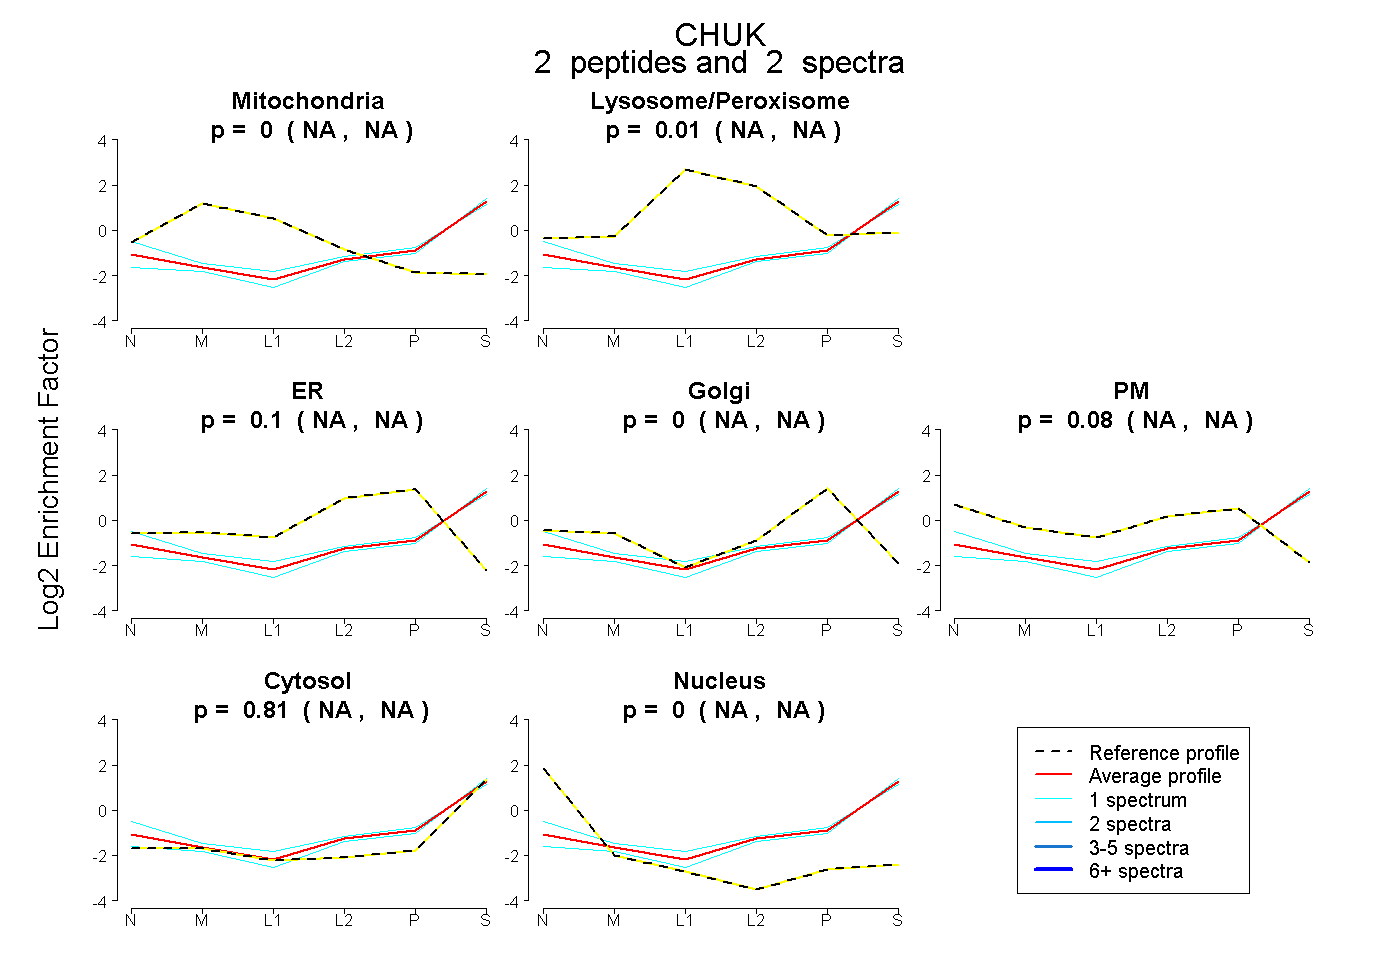
NA | NA
NA | NA
NA | NA
NA | NA
NA | NA
NA | NA
NA | NA
1peptide
spectra
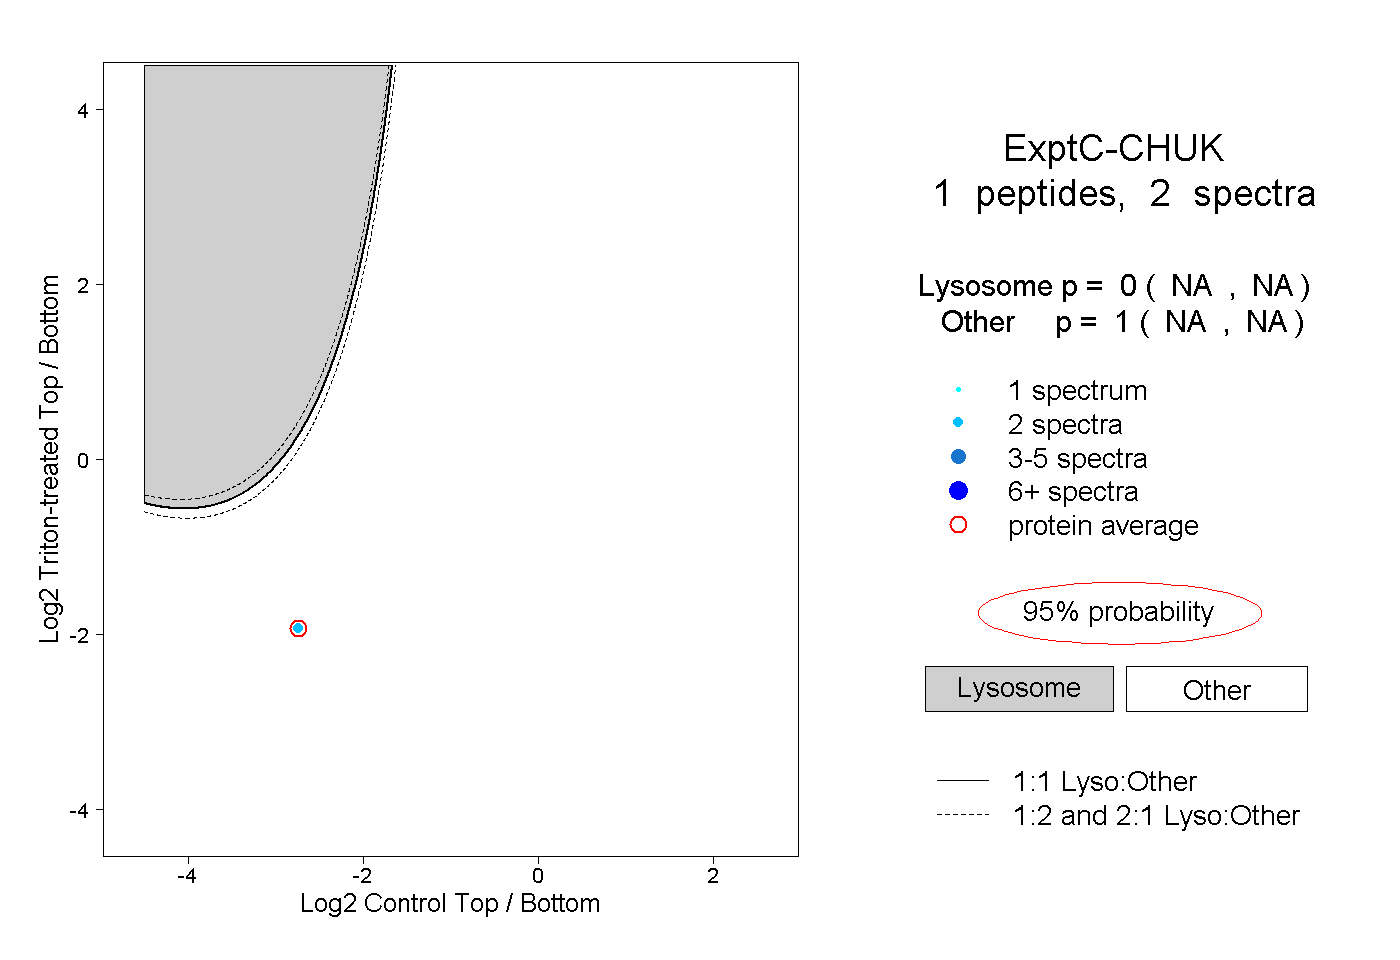
NA | NA
NA | NA
1peptide
spectrum
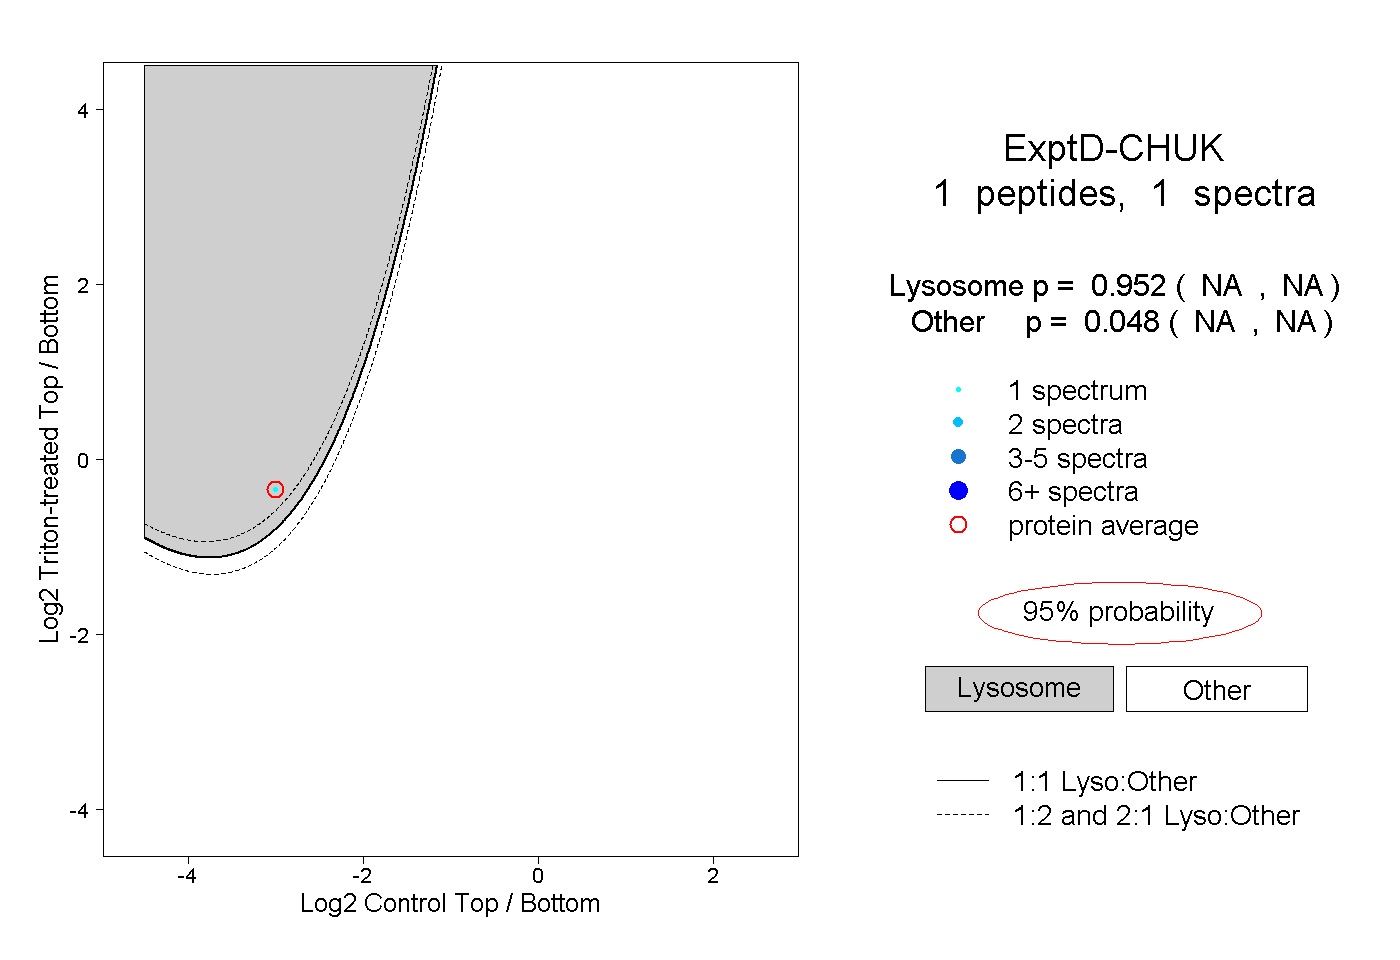
NA | NA
NA | NA