 2
2peptides
spectra
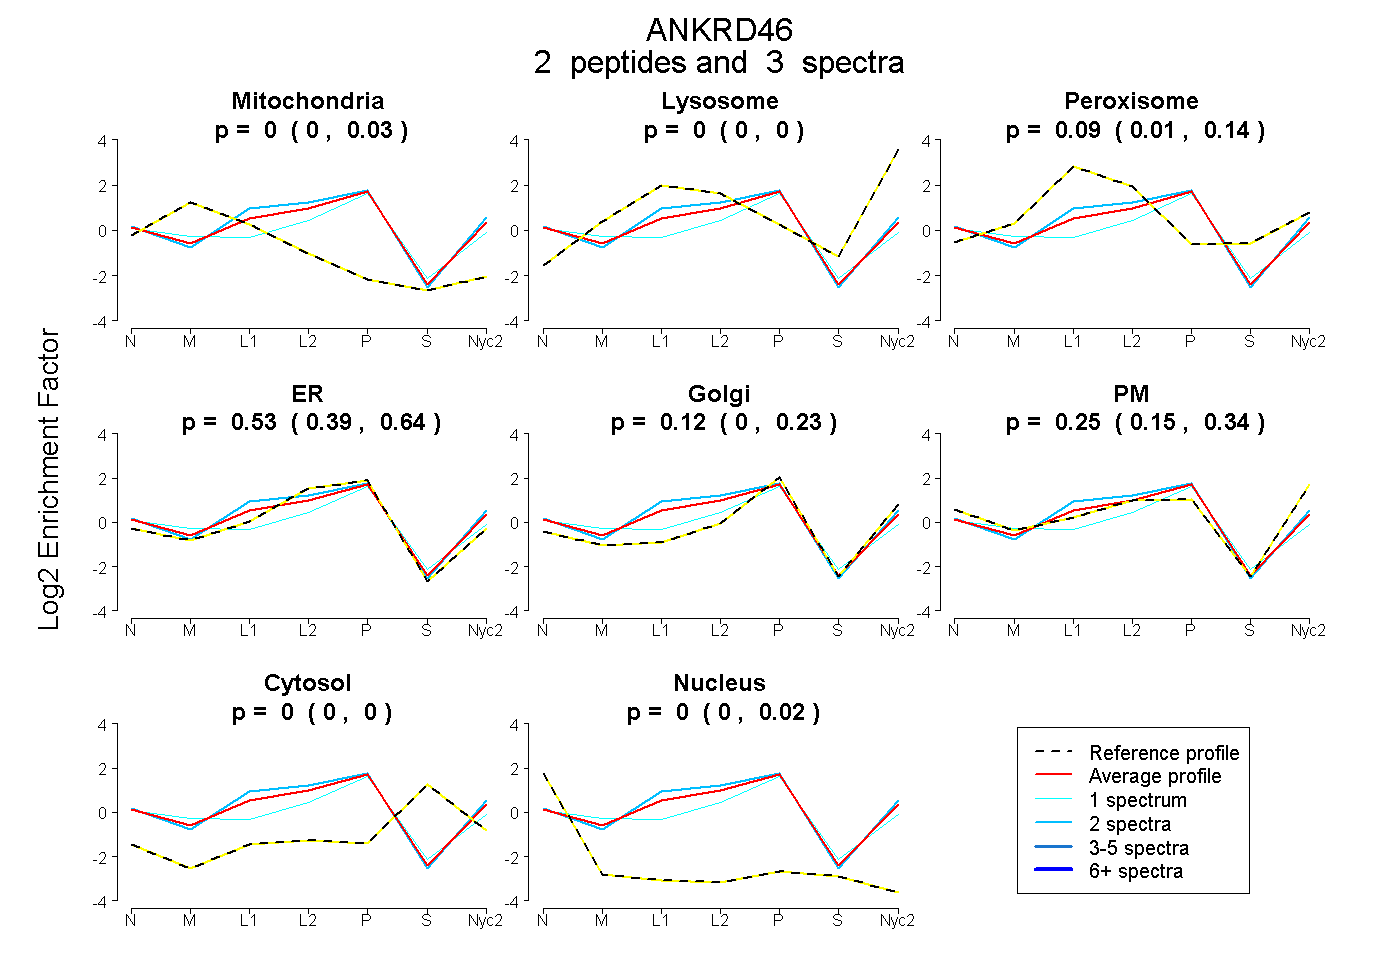
0.000 | 0.035
0.000 | 0.000
0.010 | 0.145
0.387 | 0.639
0.000 | 0.232
0.154 | 0.341
0.000 | 0.000
0.000 | 0.016
1peptide
spectra
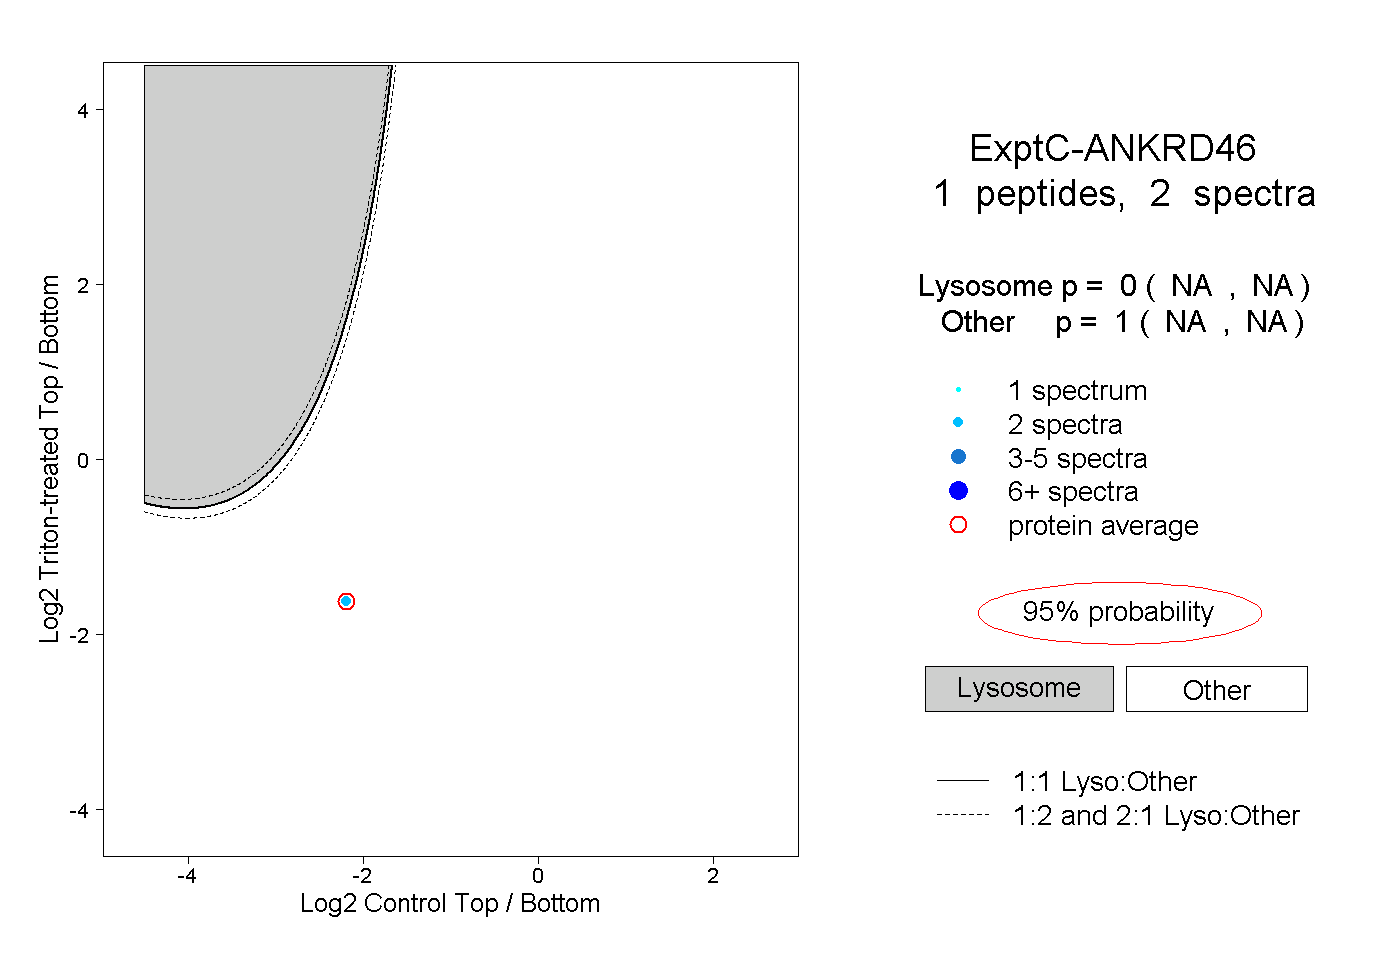
NA | NA
NA | NA
1peptide
spectrum
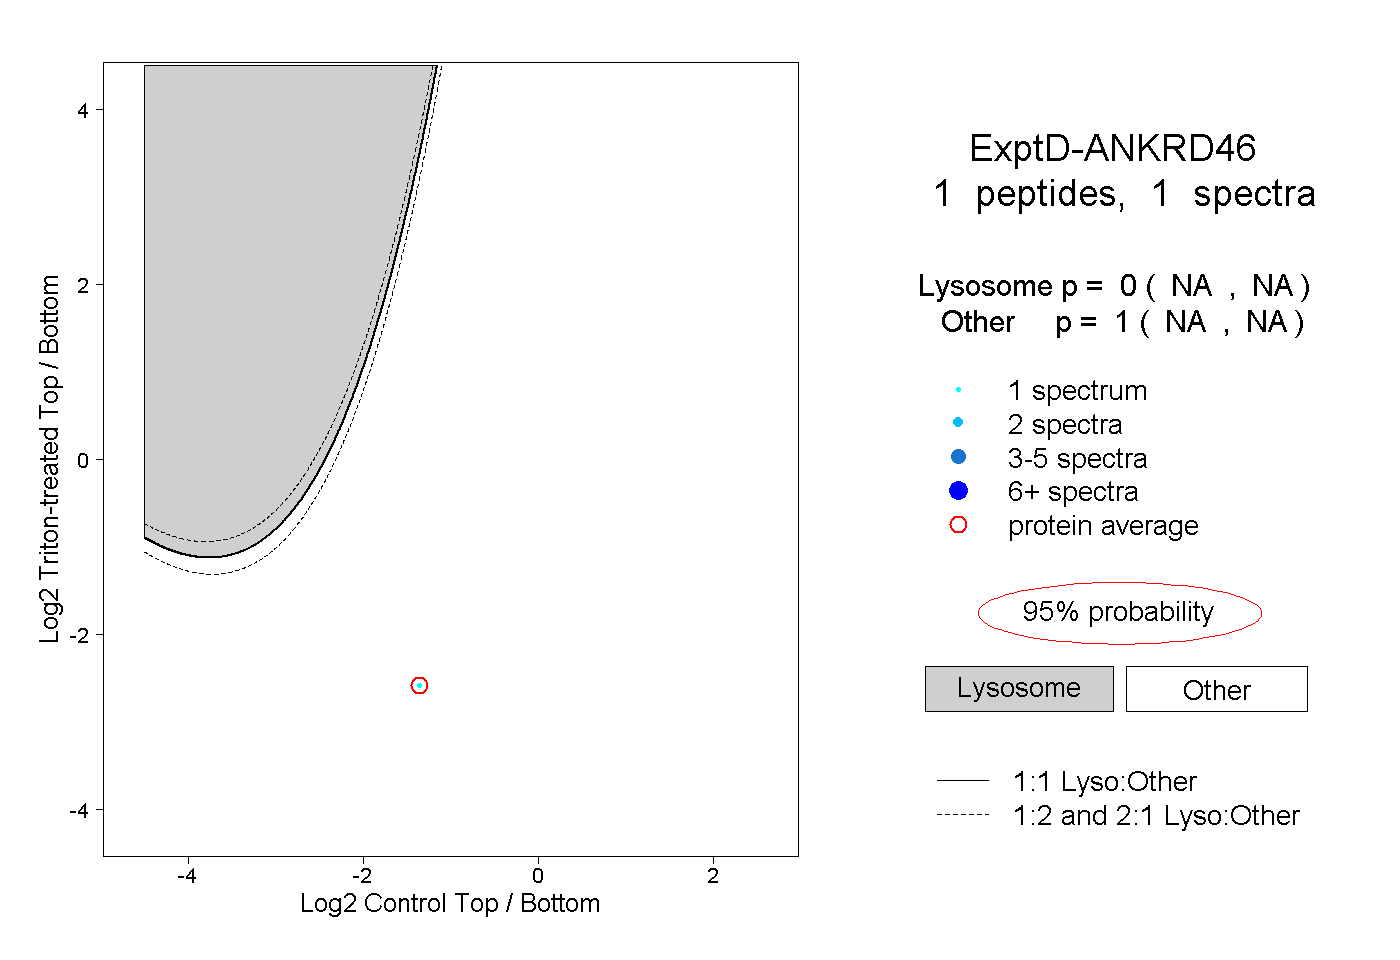
NA | NA
NA | NA