7
7peptides
spectra
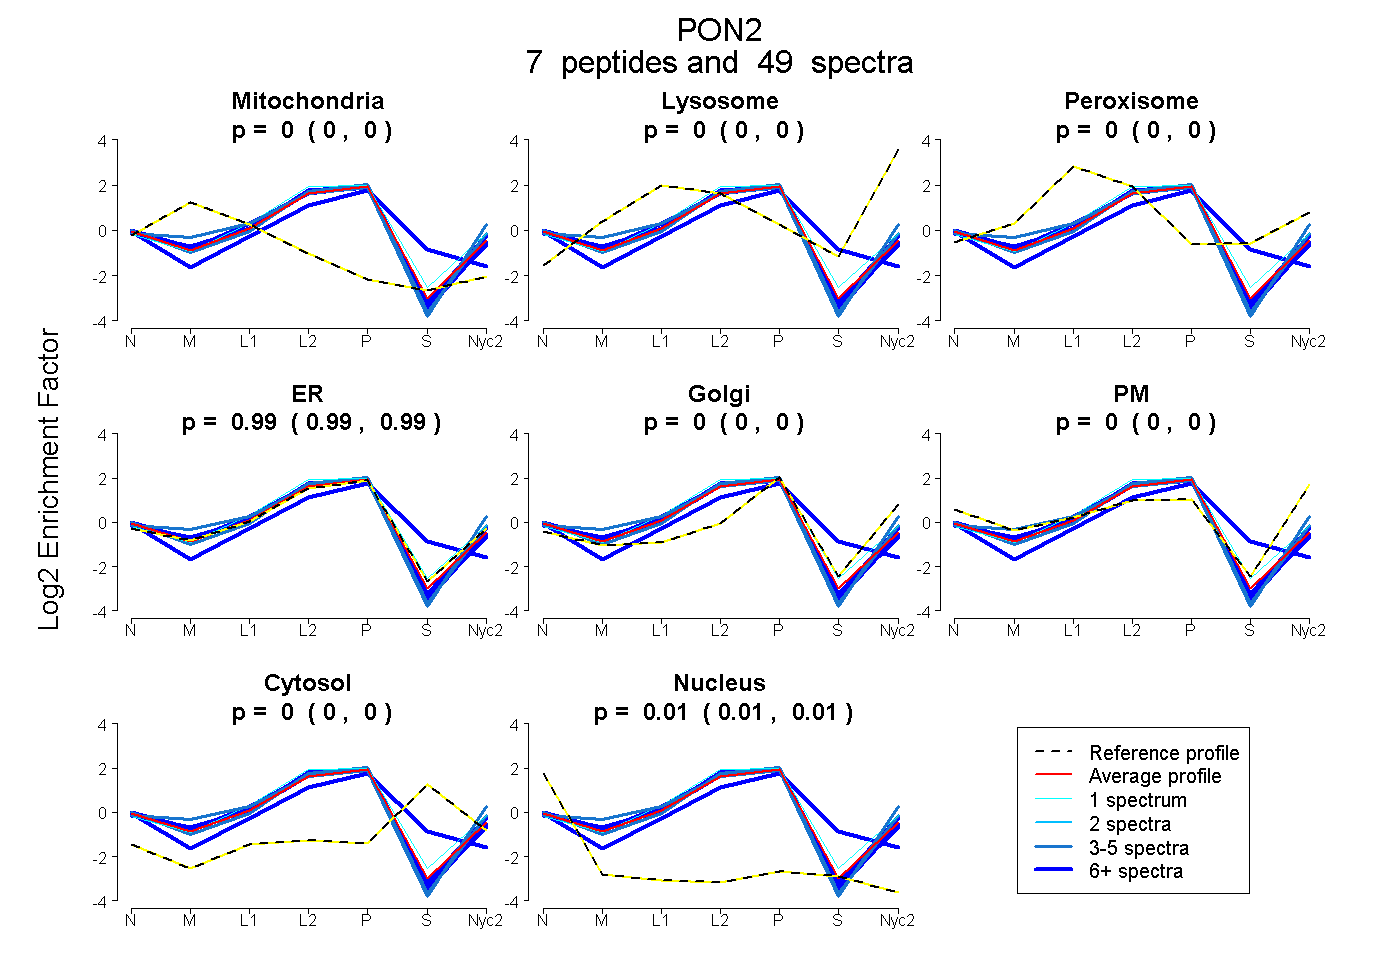
0.000 | 0.000
0.000 | 0.000
0.000 | 0.000
0.985 | 0.992
0.000 | 0.000
0.000 | 0.000
0.000 | 0.000
0.007 | 0.014
6peptides
spectra
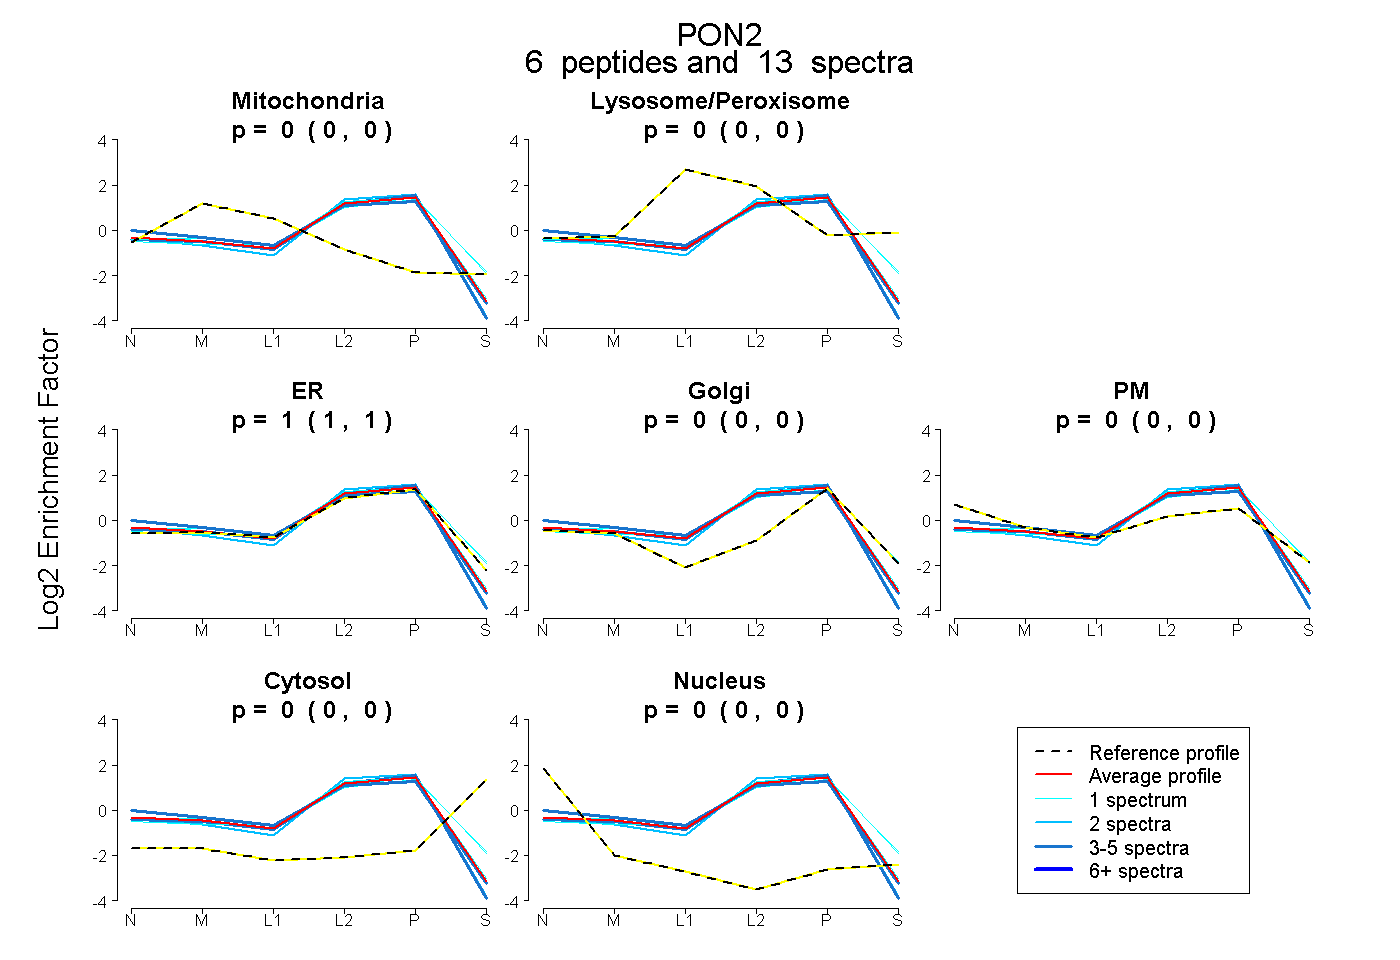
0.000 | 0.000
0.000 | 0.000
1.000 | 1.000
0.000 | 0.000
0.000 | 0.000
0.000 | 0.000
0.000 | 0.000