 4
4peptides
spectra
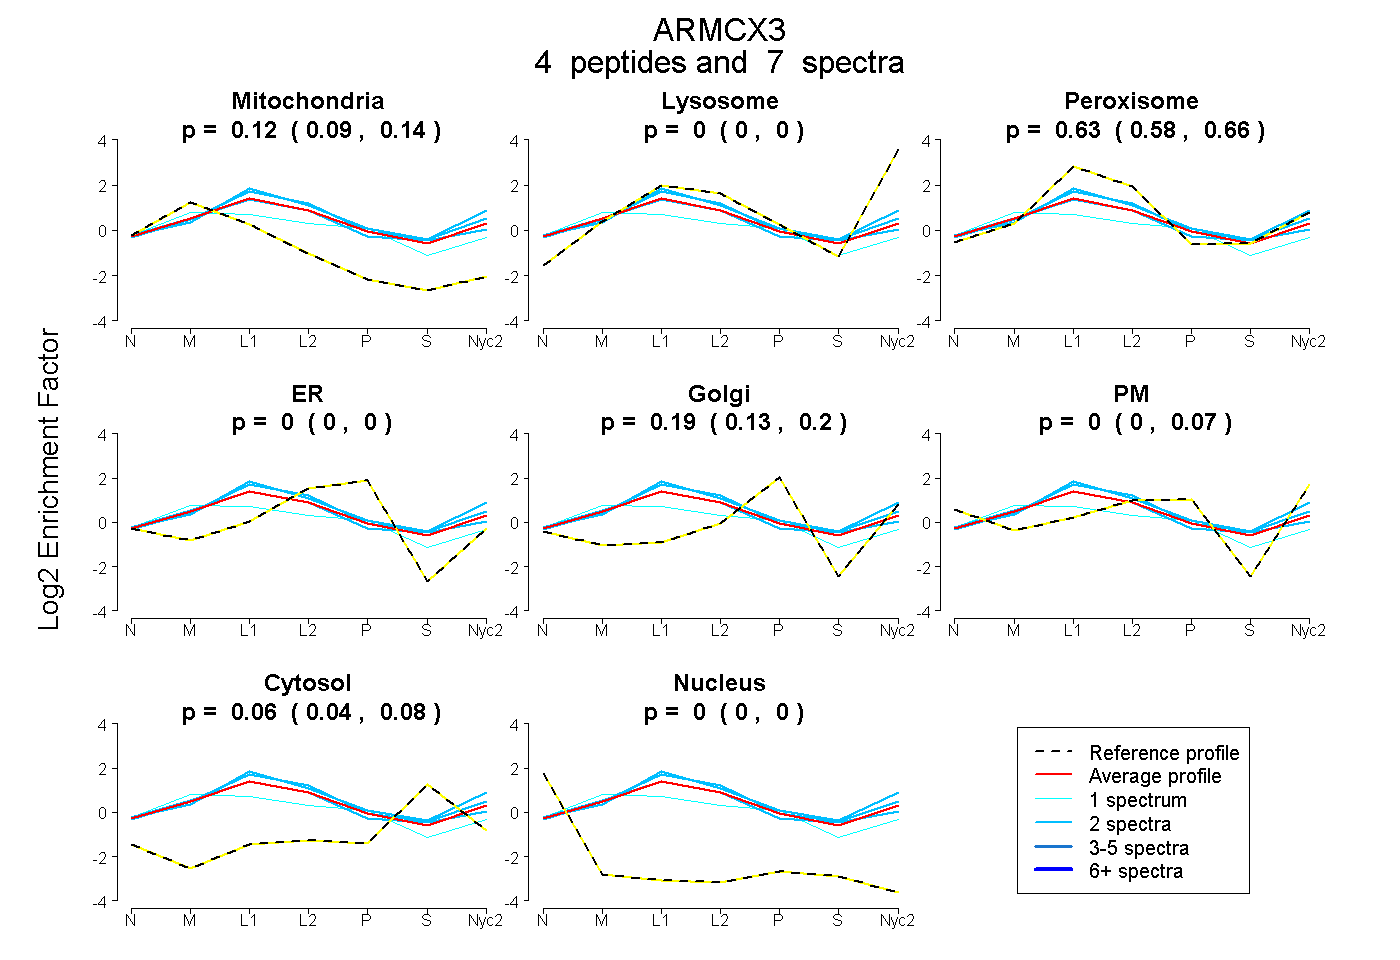
0.089 | 0.139
0.000 | 0.004
0.579 | 0.660
0.000 | 0.000
0.133 | 0.199
0.000 | 0.065
0.040 | 0.084
0.000 | 0.000
| Plot | Mito | Lyso | Perox | ER | Golgi | PM | Cytosol | Nucleus | |||||
| Expt A |
4 peptides |
7 spectra |
|
0.118 0.089 | 0.139 |
0.000 0.000 | 0.004 |
0.633 0.579 | 0.660 |
0.000 0.000 | 0.000 |
0.188 0.133 | 0.199 |
0.000 0.000 | 0.065 |
0.062 0.040 | 0.084 |
0.000 0.000 | 0.000 |
| 2 spectra, LFSAGNEETK | 0.156 | 0.000 | 0.628 | 0.000 | 0.120 | 0.000 | 0.097 | 0.000 | ||
| 1 spectrum, ALIVLNNLSVNAENQR | 0.311 | 0.000 | 0.384 | 0.000 | 0.283 | 0.000 | 0.022 | 0.000 | ||
| 2 spectra, SIVWYPPWAR | 0.000 | 0.028 | 0.710 | 0.000 | 0.114 | 0.080 | 0.068 | 0.000 | ||
| 2 spectra, LNSSVQLAGLR | 0.049 | 0.000 | 0.735 | 0.000 | 0.159 | 0.000 | 0.058 | 0.000 |
| Plot | Lyso | Other | |||||||||||
| Expt C |
4 peptides |
8 spectra |
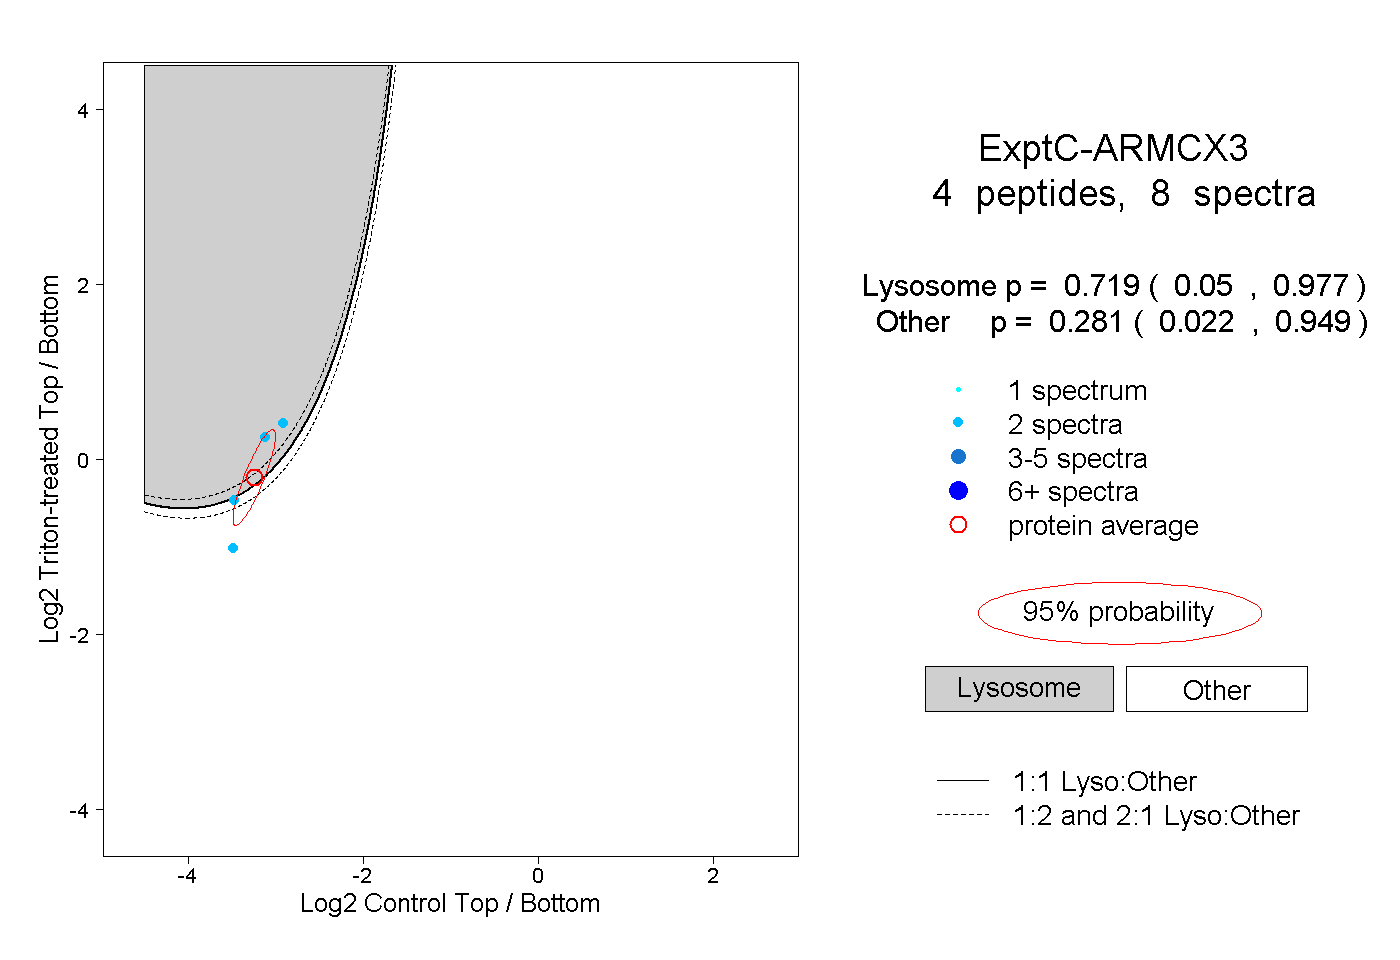 |
0.719 0.050 | 0.977 |
0.281 0.022 | 0.949 |