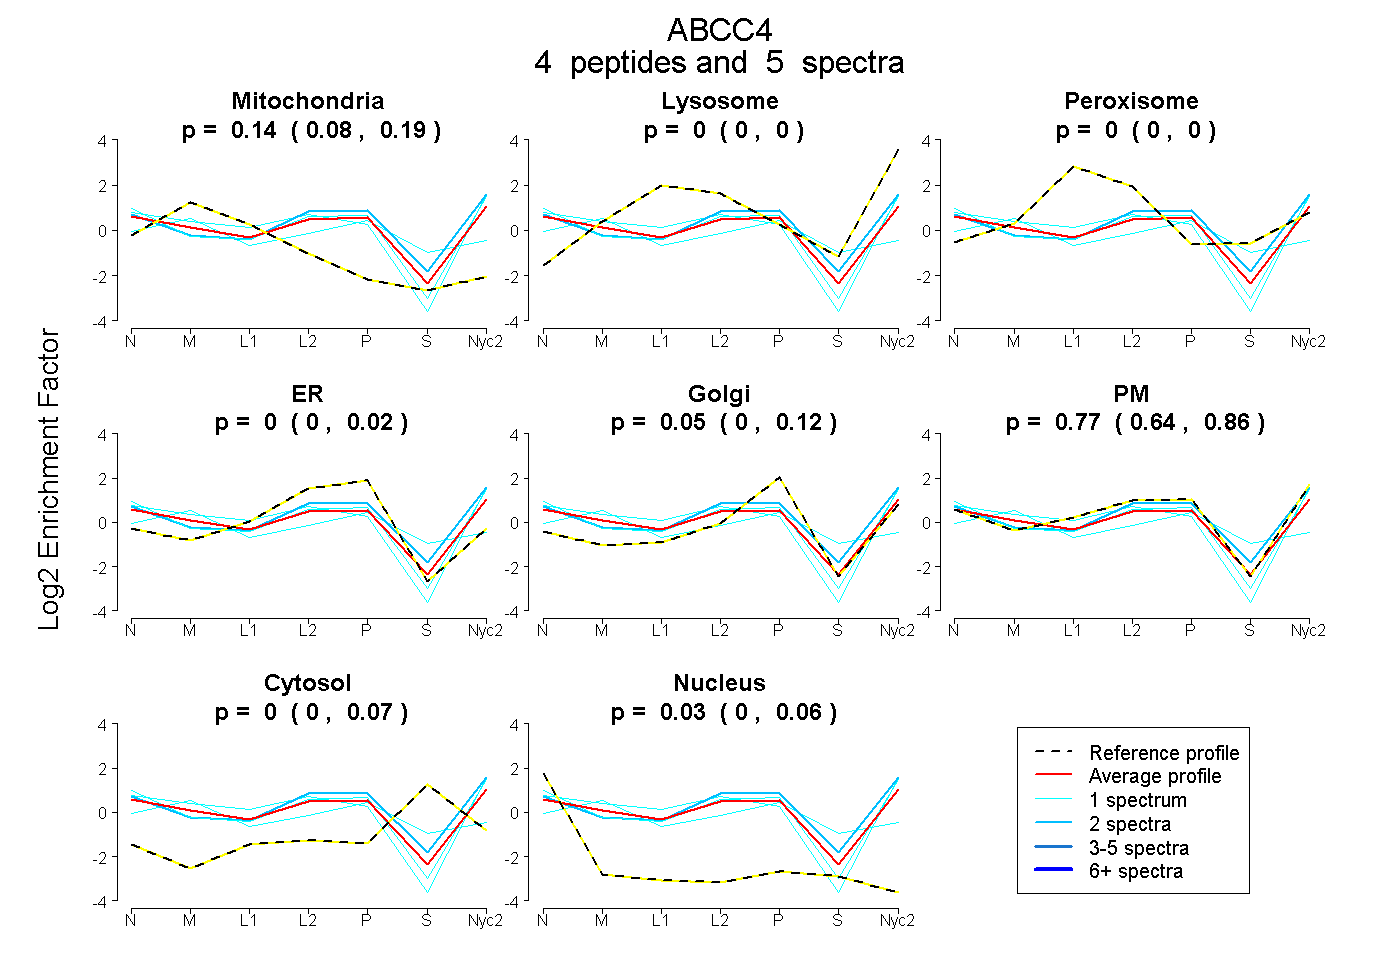
 4
4peptides
spectra
0.077 | 0.188
0.000 | 0.000
0.000 | 0.000
0.000 | 0.025
0.000 | 0.119
0.643 | 0.855
0.000 | 0.067
0.000 | 0.058
| Plot | Mito | Lyso | Perox | ER | Golgi | PM | Cytosol | Nucleus | |||||
| Expt A |
4 peptides |
5 spectra |
|
0.142 0.077 | 0.188 |
0.000 0.000 | 0.000 |
0.000 0.000 | 0.000 |
0.000 0.000 | 0.025 |
0.051 0.000 | 0.119 |
0.775 0.643 | 0.855 |
0.000 0.000 | 0.067 |
0.032 0.000 | 0.058 |
| 1 spectrum, LFSSLR | 0.153 | 0.000 | 0.000 | 0.000 | 0.000 | 0.847 | 0.000 | 0.000 | ||
| 1 spectrum, SFADLITNLR | 0.000 | 0.000 | 0.000 | 0.000 | 0.000 | 0.915 | 0.000 | 0.085 | ||
| 2 spectra, NFLLLDELPER | 0.000 | 0.000 | 0.000 | 0.000 | 0.000 | 0.908 | 0.091 | 0.000 | ||
| 1 spectrum, FAQCTVLTIAHR | 0.301 | 0.000 | 0.097 | 0.002 | 0.400 | 0.055 | 0.145 | 0.000 |
| Plot | Mito | Lyso or Perox | ER | Golgi | PM | Cytosol | Nucleus | ||||||
| Expt B |
1 peptide |
1 spectrum |
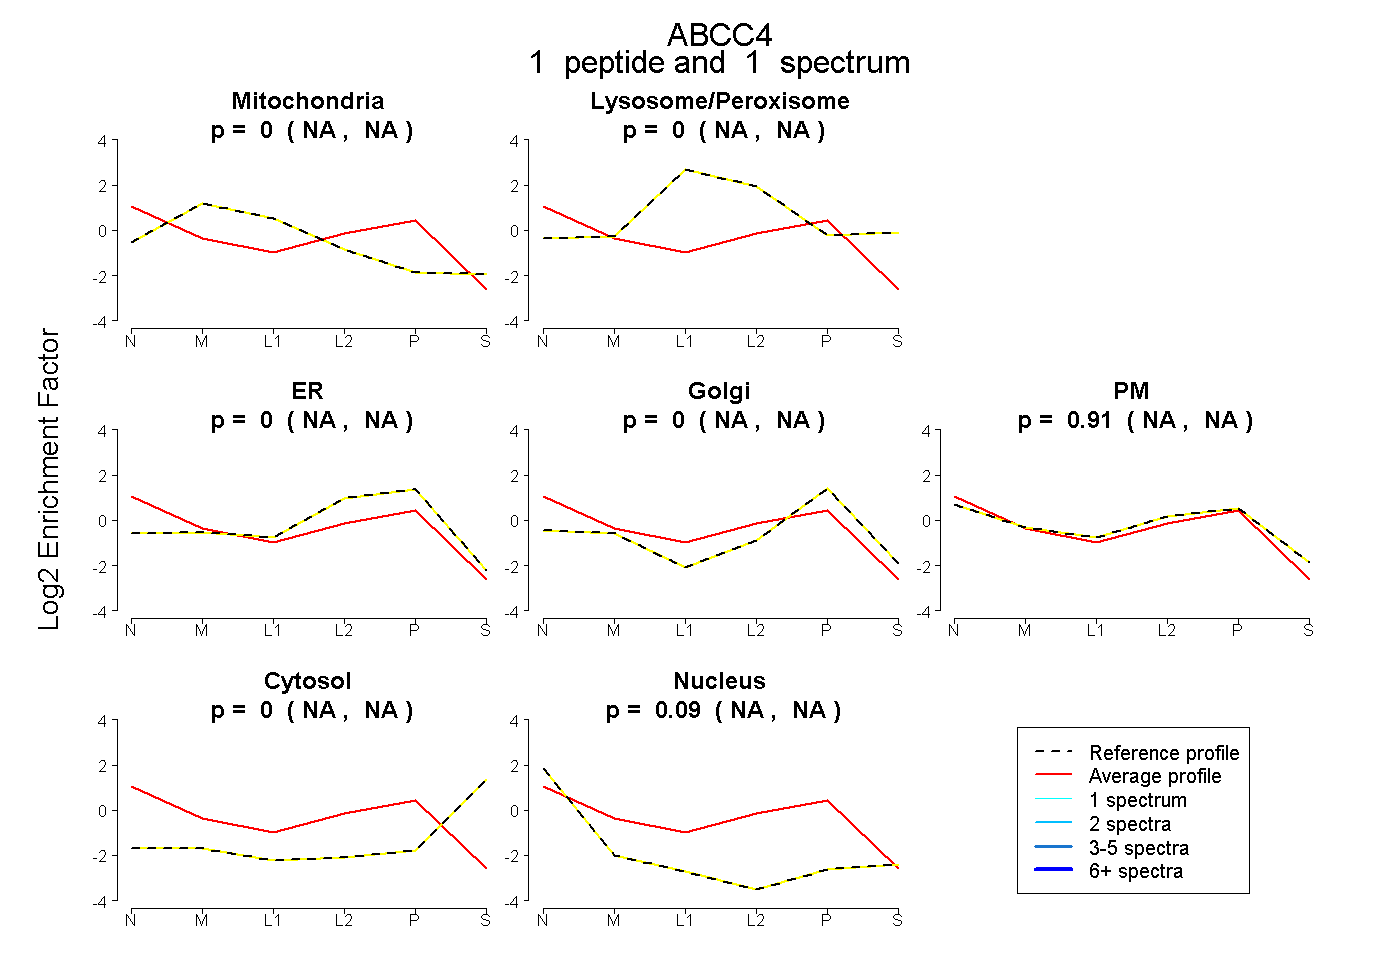 |
0.000 NA | NA |
0.000 NA | NA |
0.002 NA | NA |
0.000 NA | NA |
0.909 NA | NA |
0.000 NA | NA |
0.089 NA | NA |
|||
| Plot | Lyso | Other | |||||||||||
| Expt C |
6 peptides |
10 spectra |
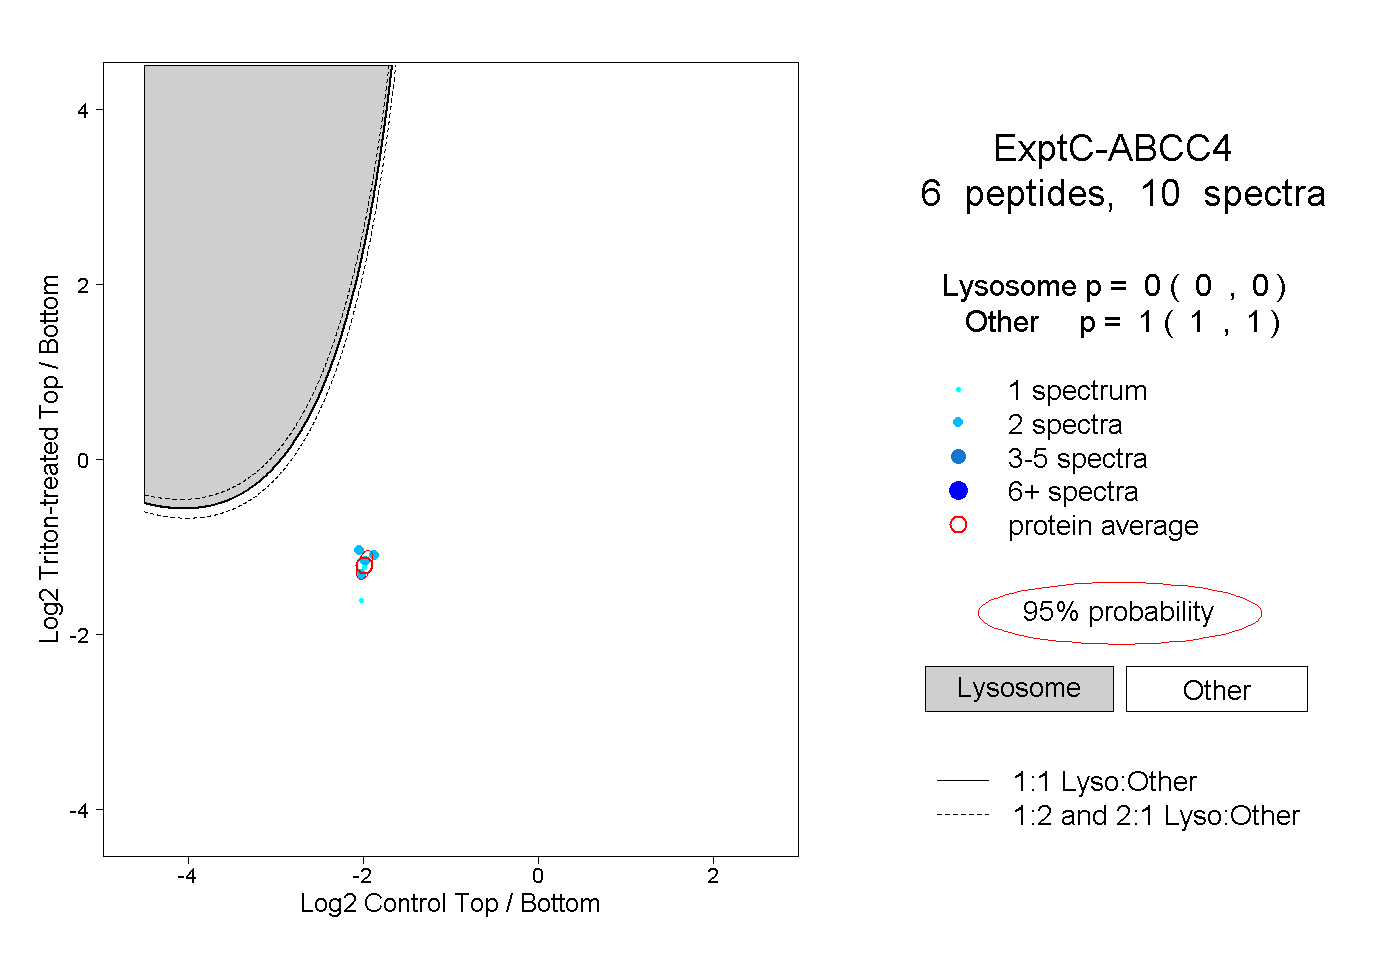 |
0.000 0.000 | 0.000 |
1.000 1.000 | 1.000 |