 9
9peptides
spectra
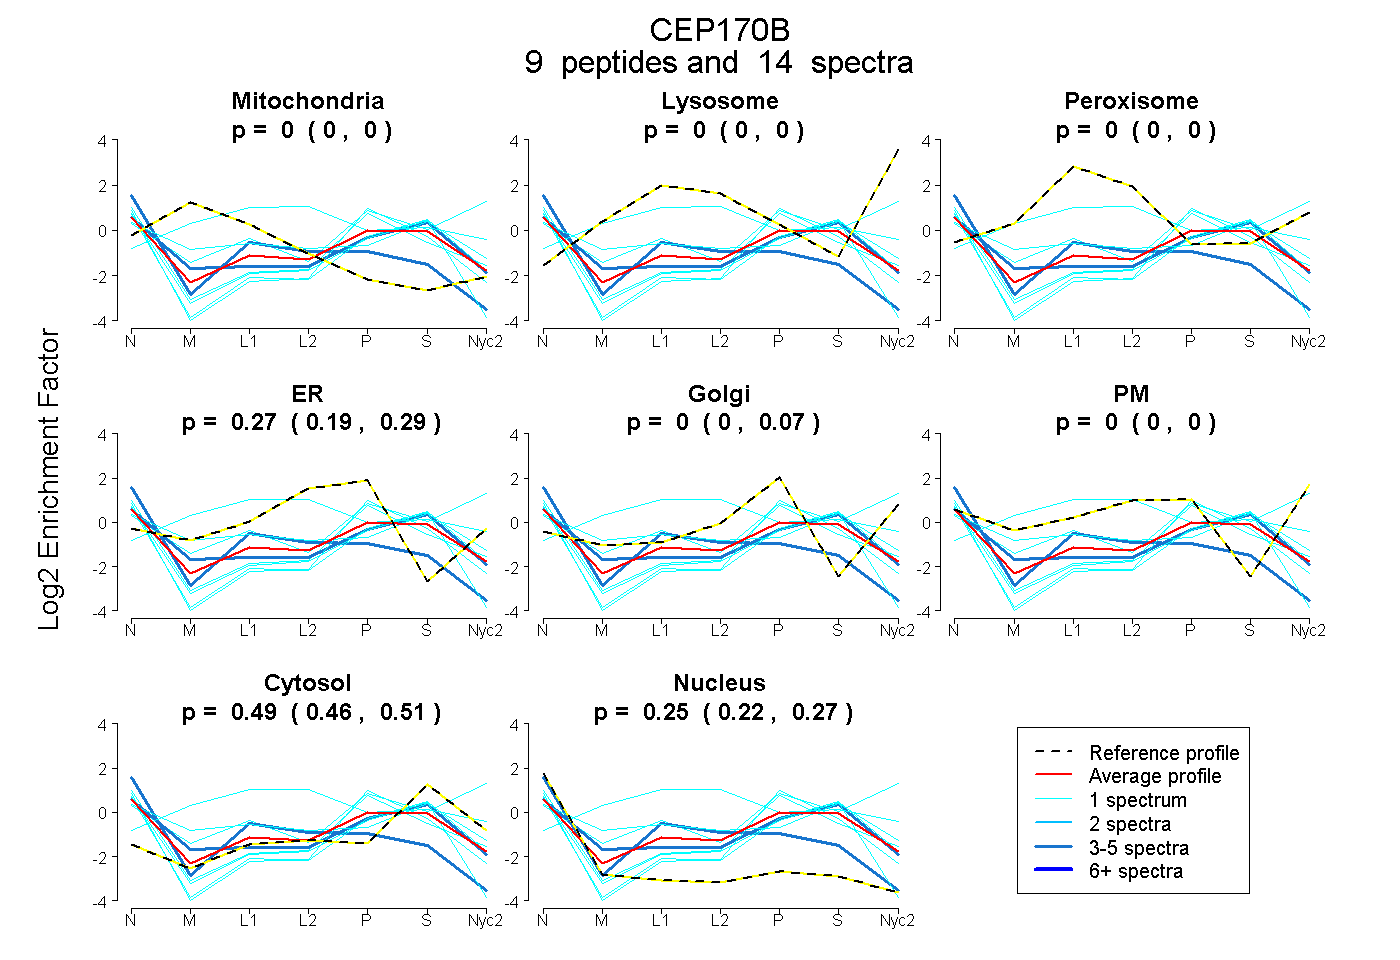
0.000 | 0.000
0.000 | 0.000
0.000 | 0.003
0.188 | 0.285
0.000 | 0.066
0.000 | 0.000
0.457 | 0.505
0.219 | 0.269
1peptide
spectrum

NA | NA
NA | NA
NA | NA
NA | NA
NA | NA
NA | NA
NA | NA
2peptides
spectra
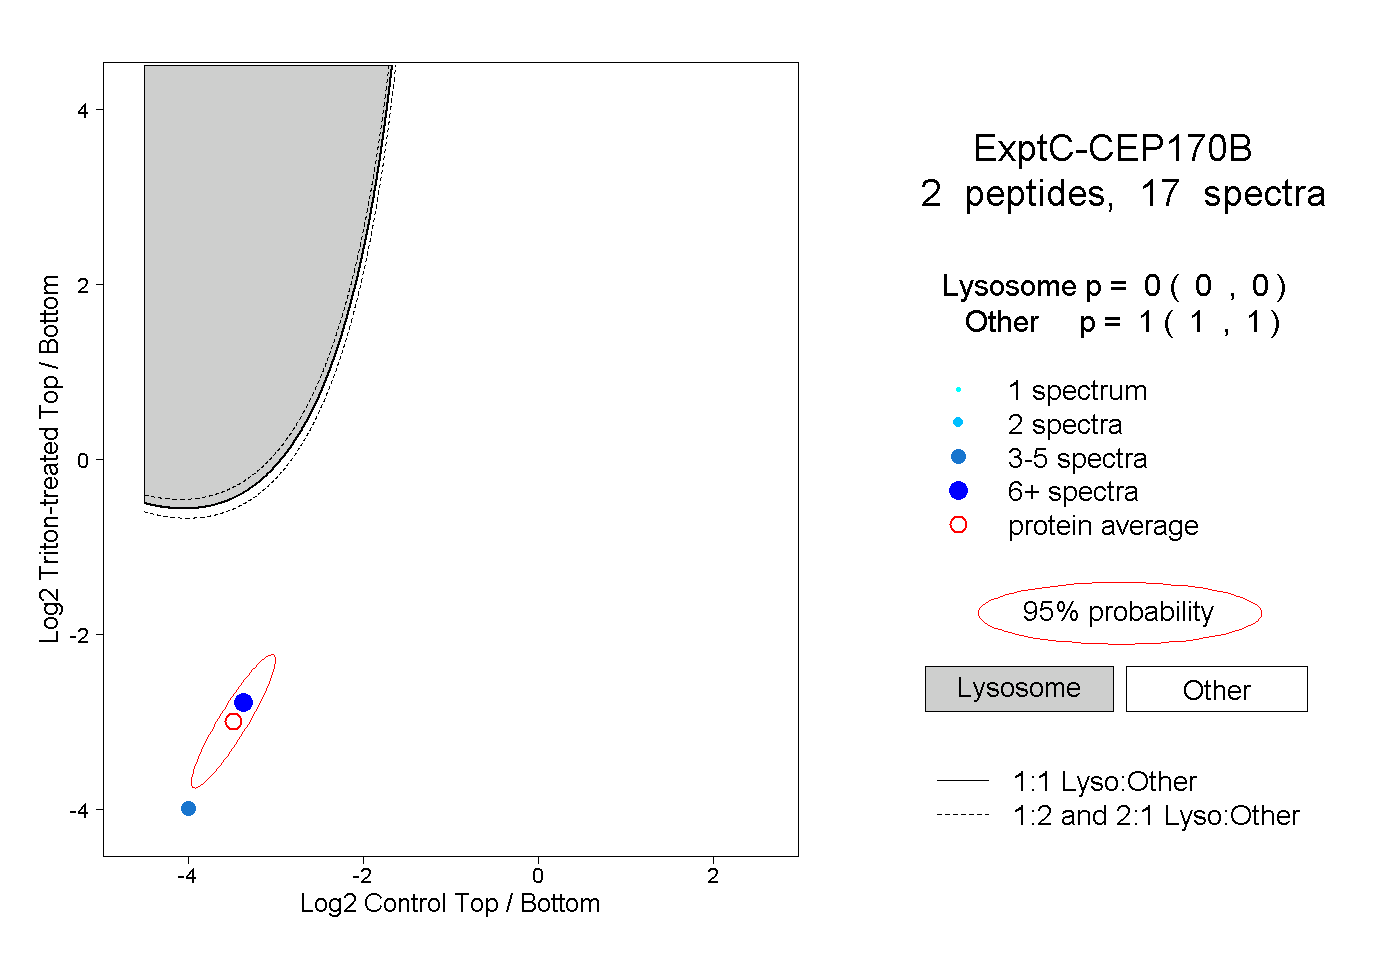
0.000 | 0.000
1.000 | 1.000